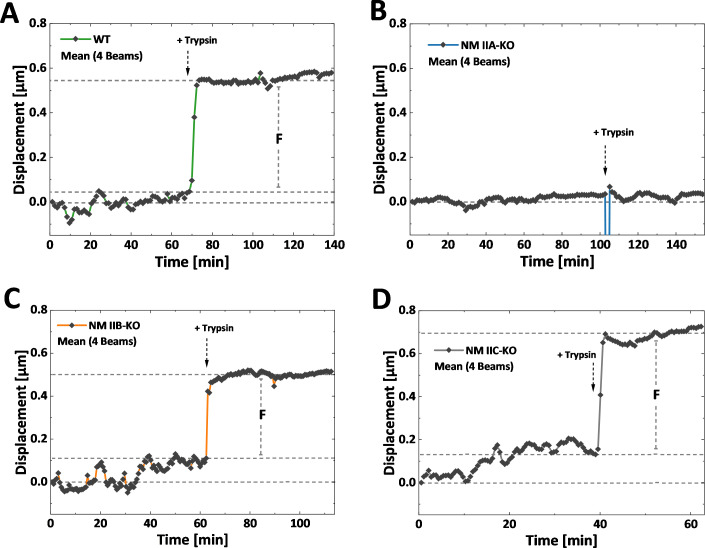
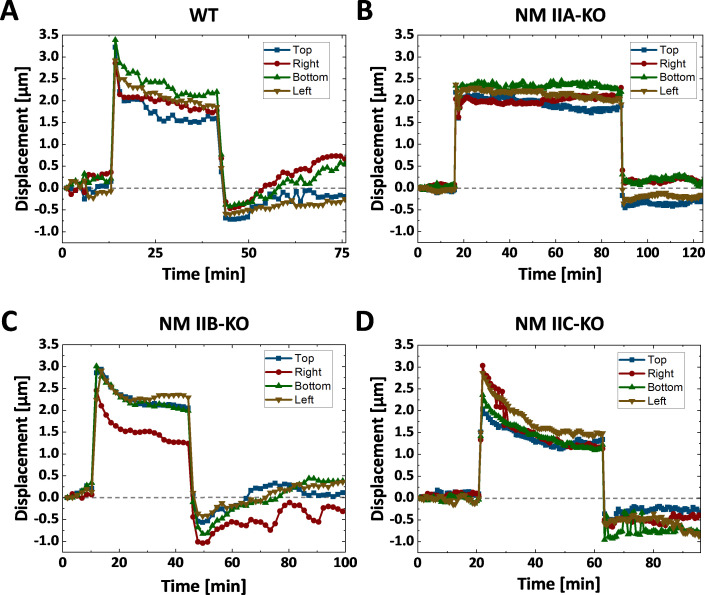
Figure 5. Differential contributions of NM II isoforms to cellular mechanoresponse.
Cells were cultured 3D micro-scaffolds composed of four non-adhesive walls, each with an inward directed protein-adhesive bar to guide cell attachment. Cells attach to the bars, form a cross-shaped morphology and pull the walls inwards. (A) Initial cellular tractions forces were determined by detaching the cell from the scaffold using trypsin/EDTA and measuring the corresponding average beam displacement as indicated in the plot. (B) Comparison of the initial forces of the different cell lines. Data for WT and NM IIA-KO have been reproduced from (B) of Hippler et al., 2020, therefore only the mean values are shown (originally published under the Creative Commons Attribution-Non Commercial 4.0 International Public License (CC BY-NC 4.0; https://creativecommons.org/licenses/by-nc/4.0/. Further reproduction of this panel would need to comply with the terms of this license)). No significant differences were observed between WT (mean value = 94 nN), NM IIB-KO (mean value = 112 nN), and NM IIC-KO cells (mean value = 110 nN). A significant decrease was observed for NM IIA-KO cells (mean value = 11 nN). (C) Illustration depicting the stretch-release cycle applied to the cells. (D-G) Examples of average beam displacements (corresponding to Figure 5—animations 5–8) are plotted as a function of time. The blue area depicts the time frame, in which the corresponding cell was stretched. (D) WT cells actively counteract the stretch and increase their contractile forces until reaching a plateau after ~ 30–40 min. After releasing the stretch, cellular contraction forces remained high, but decreased to the initial level after 20–30 min. (E) No cellular force response is observed, when applying the stretch-release cycle to NM IIA-KO cells, even after longer stretch periods. (F) NM IIB-KO cells increase their force after stretching and reach a plateau after 30–40 min. The force increase is lower compared to WT cells. After releasing the stretch, NM IIB-KO cells also reduce their forces until the initial set point is reached. (G) NM IIC-KO cells increase their force upon the stretch but do not relax to the initial setpoint within the observed timeframe. (H) The quantification shows that a force decrease after the stretch release was observed for 78% of the WT cells but only for 22% of the NM IIC-KO cells. (I) Comparison of the force increase of WT and NM II-KO cells, after being mechanically stretched. Data for WT and NM IIA-KO reproduced from (D) of Hippler et al., 2020, therefore only the mean values are shown (originally published under the Creative Commons Attribution-Non Commercial 4.0 International Public License (CC BY-NC 4.0; https://creativecommons.org/licenses/by-nc/4.0/. Further reproduction of this panel would need to comply with the terms of this license)). A mean increase of 73 nN was observed for WT cells and no force increase for NM IIA-KO cells (mean value = 0.29 nN). Compared to WT cells, NM IIB-KO cells display a significantly lower force increase (mean value = 41 nN), while NM IIC-KO cells show a comparable mean value. However, higher variations in the force response are observed for NM IIC-KO cells. Scale bar represents 10 µm in (A).


