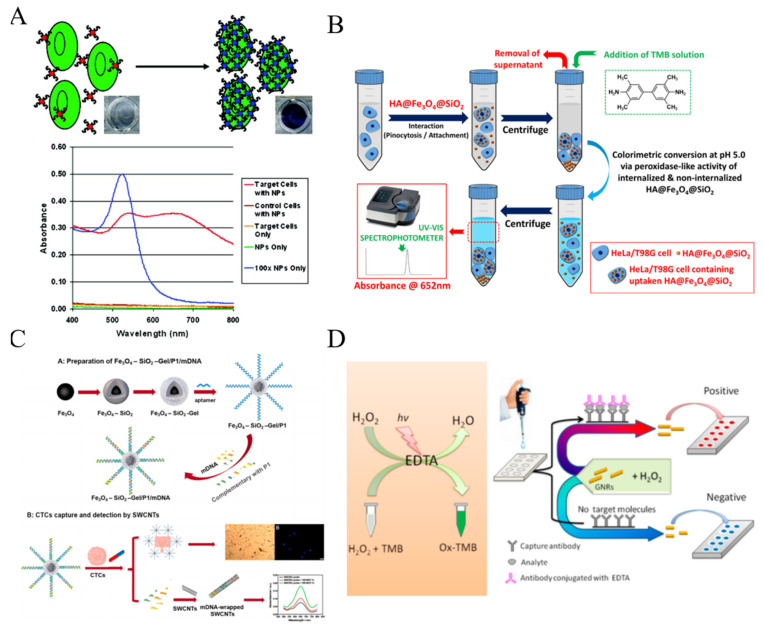
Figure 5.
(A) Schematic representation of the ACGNP based colorimetric assay [97]. Copyright 2008 American Chemical Society. (B) Schematic representation of colorimetric protocol developed for determination of HeLa or T98 G cell concentration based on the variation of peroxidase-like activity of cell internalizable HA@Fe3O4@SiO2 microspheres [100]. Copyright 2020 Elsevier B.V. (C) Schematic representation of Fe3O4–SiO2-Gel/P1/mDNA, CTCs capture and subsequent colorimetric detection of the captured CTCs by SWCNTs colorimetric probe [101]. Copyright 2021 Elsevier B.V. (D) Schematic representation of visual read-out for determination of CTCs by combining EDTA-based sensor with immunomagnetic separation of CTCs from blood [105]. Copyright 2017 American Chemical Society.

