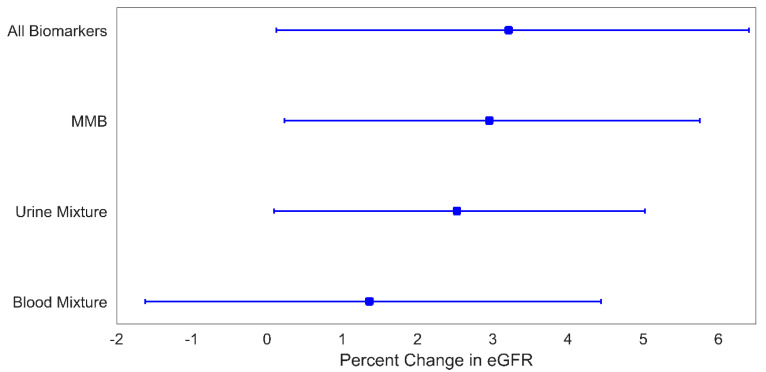
Figure 3.
Percent change in eGFR for a 1-quartile increase in metal mixture levels. Plotted points are beta coefficients and lines are 95% confidence intervals. All models were adjusted for child age (years), child sex, indoor tobacco smoke exposure (referent group: no), SES (referent group: lower), and BMI (referent group: BMI z-score < 1). The p-values for these associations are: 0.04 (all biomarkers), 0.03 (MMB), 0.04 (urine mixture), and 0.37 (blood mixture).

