Figure 4.
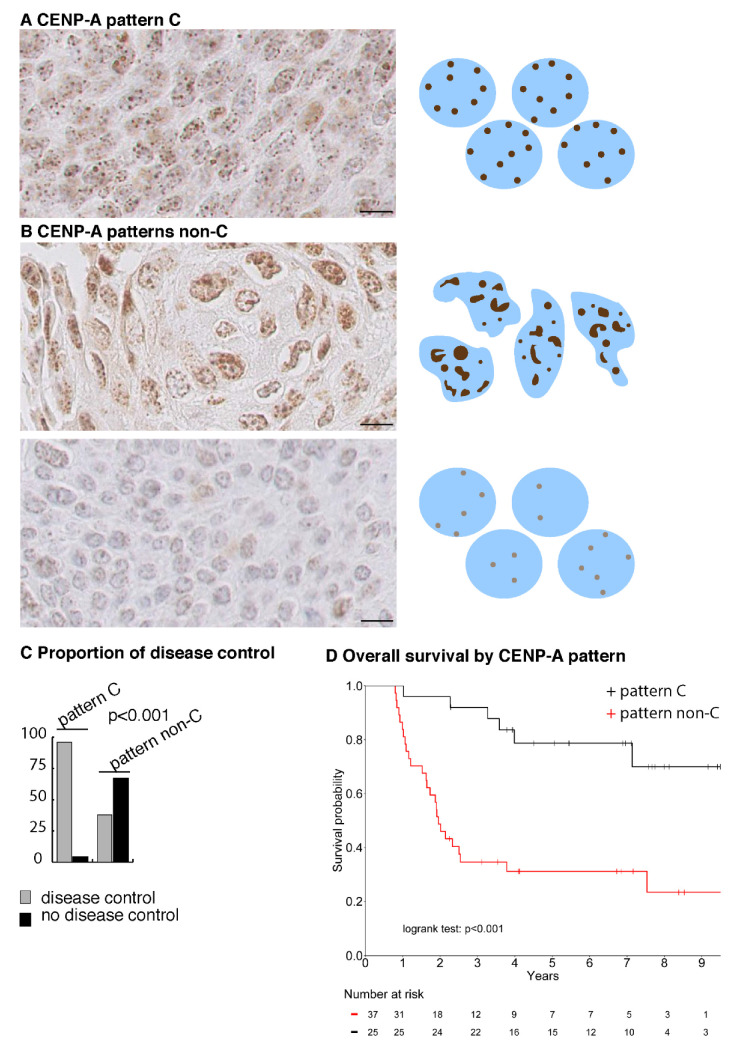
CENP-A nuclear localization pattern is a marker of disease control by CCRT in HNSCC patients. (A) CENP-A IHC images of HNSCC biopsies corresponding to CENP-A pattern-C. Scale bar is 10 µm. A scheme depicting the pattern is shown on the right (B) as in (A), but for CENP-A pattern non-C. (C) Graph showing proportion (in %) of disease control in biopsies from patients displaying CENP-A pattern-C or non-C. (D) Kaplan–Meier survival curve of patients treated by CCRT with CENP-A pattern-C (black) and CENP-A pattern non-C (red).

