Figure 8.
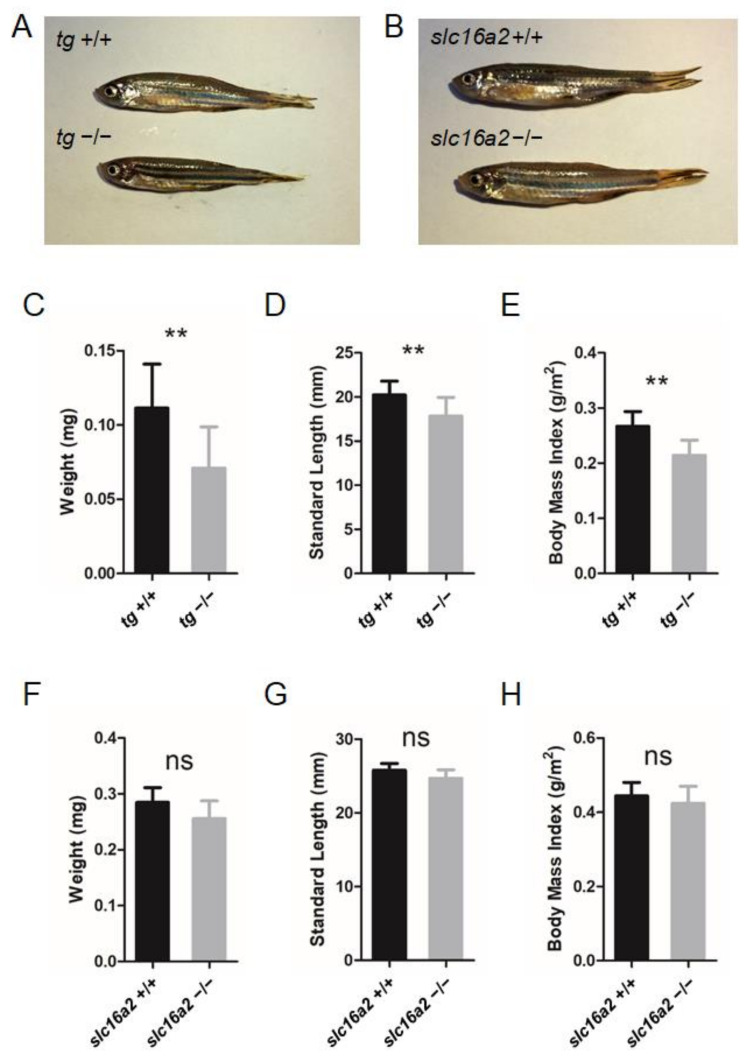
Somatic growth in tg or slc16a2 mutant zebrafish. (A) Control wild-type zebrafish and tg mutant zebrafish at 2 mpf. (B) Control wild-type zebrafish and slc16a2 mutant zebrafish at 2 mpf. (C–E) Body weight (C), standard length (SL) (D), and body mass index (BMI) (F) of tg mutants and their wild-type siblings at 2 mpf. Measurements were taken from wild-type fish (n = 12) and tg mutant fish (n = 13). (F–H) Body weight (F), SL (G), and BMI (H) of slc16a2 mutants and their wild-type siblings at 2 mpf. Measurements were taken from wild-type fish (n = 6) and slc16a2 mutant fish (n = 8); ** p < 0.01, ns: No significance.

