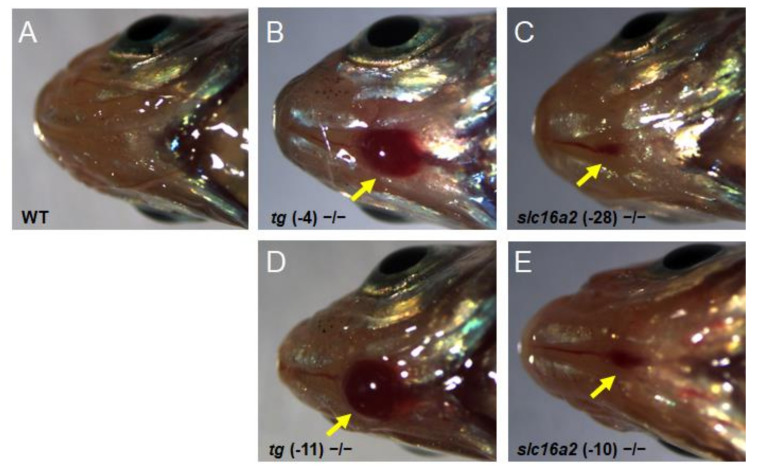
Figure 9.
Goiter seen in tg mutant and slc16a2 mutant zebrafish. (A–E) Representative macroscopical pictures of the head region of wild-type zebrafish (A), tg (-4) zebrafish (B), tg (-11) mutant zebrafish (C), slc16a2 (-10) mutant zebrafish (D), and slc16a2 (-28) mutant zebrafish (E) at 3 mpf. The red mass of the thyroid is indicated by the yellow arrows.

