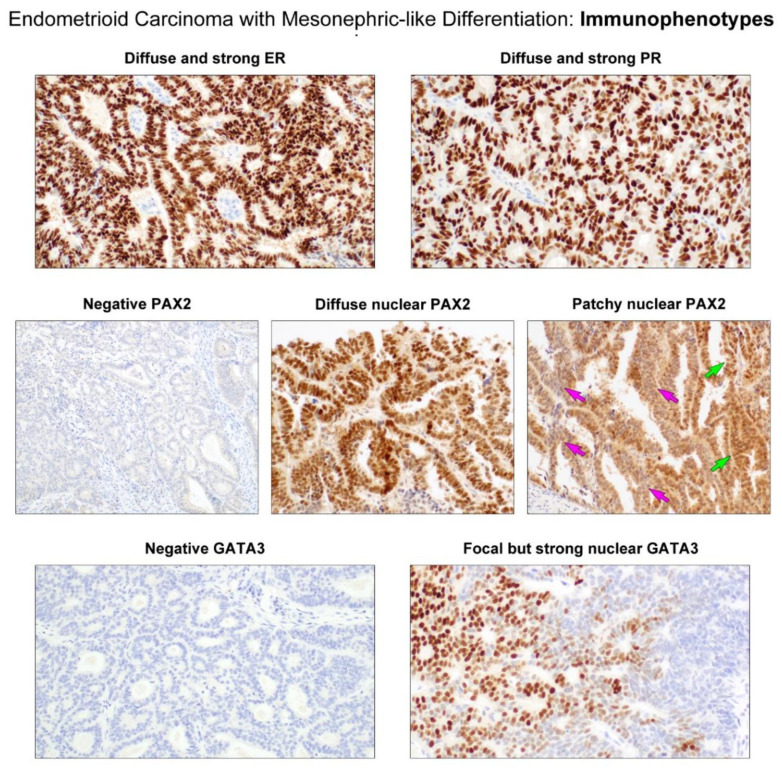
Figure 4.
Immunostaining results. (Upper panels) The tumor cell nuclei display strongly positive staining for ER and PR. (Middle panels) PAX2 immunostaining reveals variable staining proportion: complete absence of expression (negative PAX2) and diffuse or patchy positivity. The green arrows indicate the tumor cells showing strong nuclear PAX2 expression, while those indicated by the pink arrows display weak-to-moderate cytoplasmic immunoreactivity. (Lower panels) Similar to PAX2 expression status, the majority of the tumor cells are negative for GATA3, but a small number of compactly aggregated tubules react strongly with GATA3.

