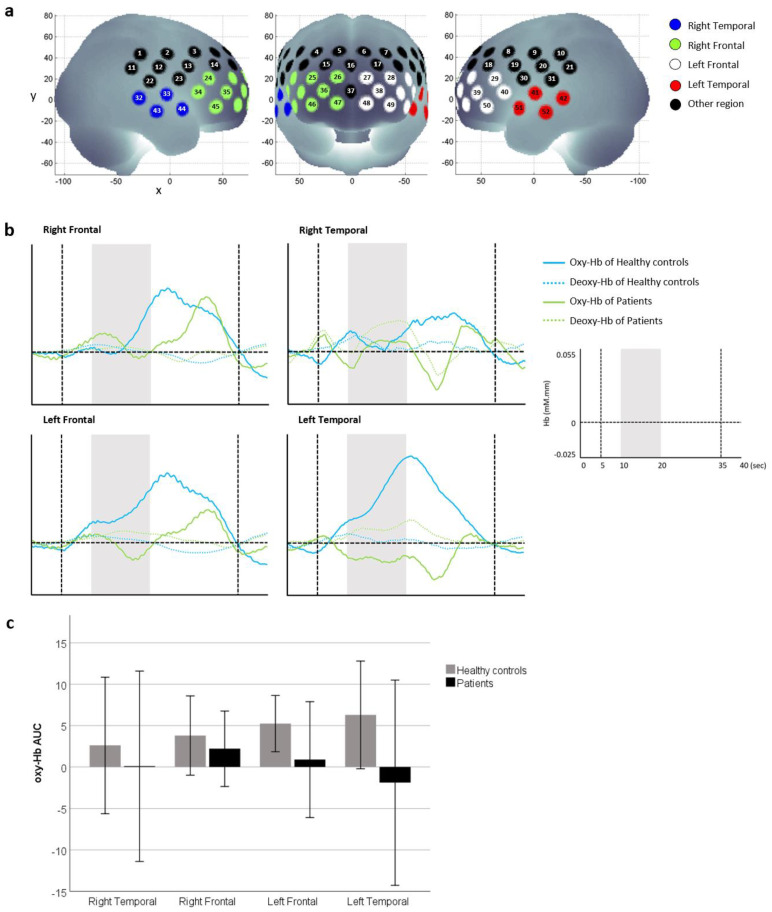
Figure 1.
(a) Four regions called the right and left frontal and temporal regions were studied. (b) Average oxy-hemoglobin and deoxy-hemoglobin waveforms of patients who recovered from COVID-19 infection and healthy controls who never contracted COVID-19 were generated for each region. Grey areas indicate the olfactory stimulus period, and vertical dotted lines indicate the time period used to calculate the AUC of oxy-hemoglobin. (c) Comparison of oxy-hemoglobin AUC between healthy controls and patients. Data are presented as mean ± SD. There were no differences between groups when oxy-hemoglobin AUC at each region were compared using Mann–Whitney U tests (p > 0.05).

