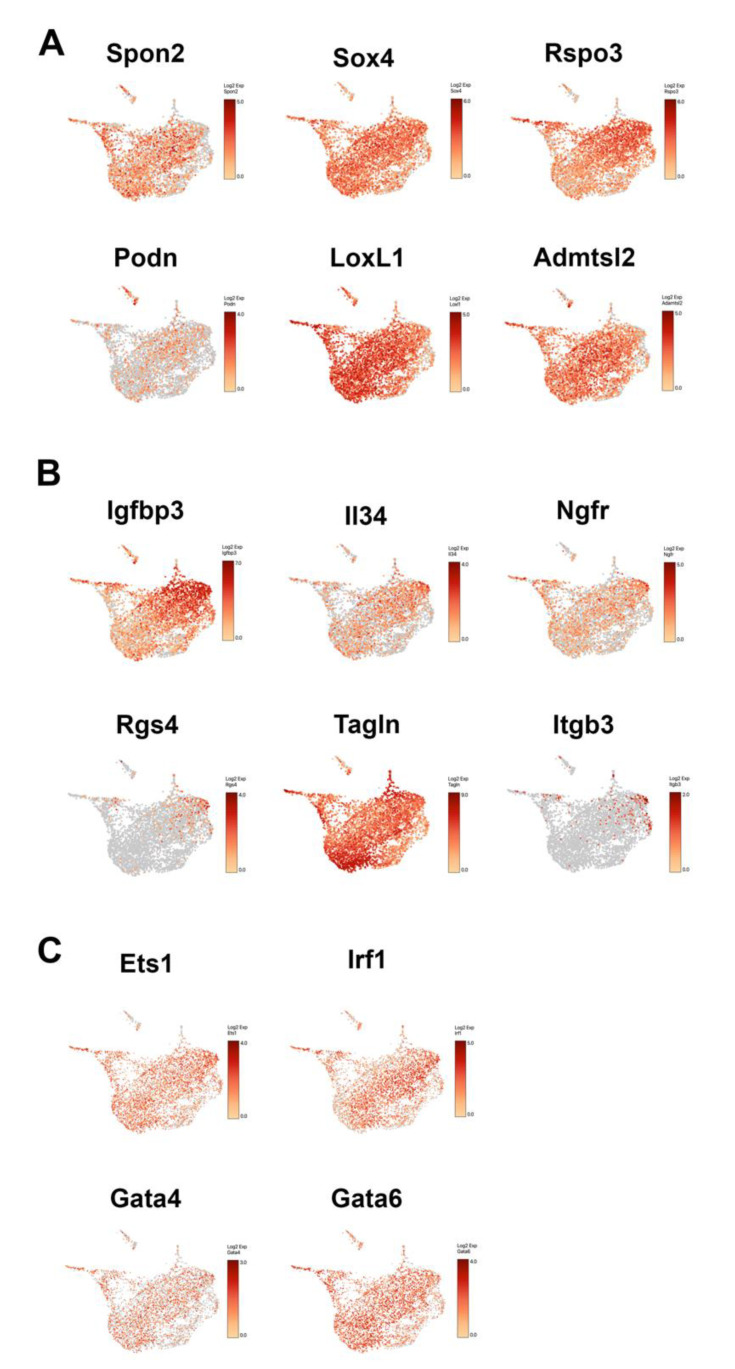
Figure 6.
The comparison of the expression of CV HSC markers and PV HSC markers in HSC subtypes. (A) Representative UMAP Loupe images of the expression pattern of the selected CV HSC marker genes. Each dot represents a single cell. (B) Representative UMAP Loupe images of the expression pattern of the selected PV HSC marker genes. Each dot represents a single cell. (C) Representative UMAP Loupe images of the expression pattern of the selected HSC regulators, Ets1, Irf1, Gata4 and Gata6. Each dot represents a single cell.

