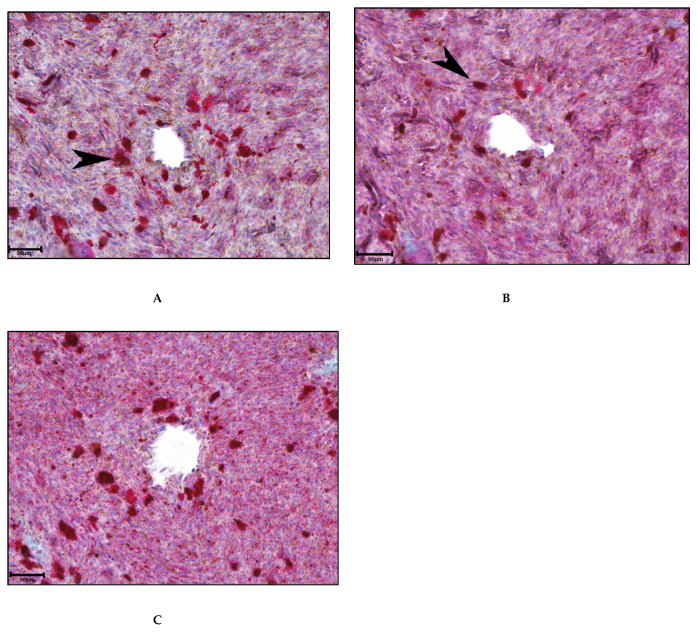
Figure 4.
Representative immunohistochemical analysis to determine the expression of ANG-2 and infiltration of T-cells and M2 macrophages in primary tumor material: Scale bar is 50 um. (A) CD163 expression to identify M2 macrophages (black arrow); (B) CD3 to identify lymphocytes (black arrow); (C) ANG-2 expression (original magnification 10.0×, red chromogen).

