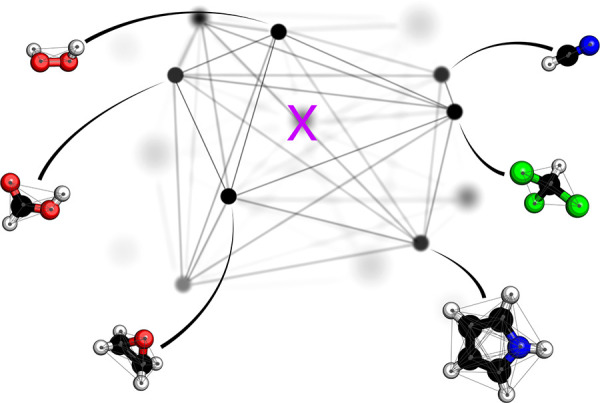
Figure 2.

3D projection of high-dimensional kernel representation of chemical compound space. Within kernel ridge regression, chemical compound space corresponds to a complete graph where every compound is represented by a black vertex and black lines correspond to the edges which quantify similarities. Each compound, in return, can be represented by a molecular complete graph (e.g., the Coulomb matrix (CM)195) recording the elemental type of each atom and its distances to all other atoms. Given known training data for all compounds shown, a property prediction can be made for any query compound as illustrated by X. Choice of kernel-function, metric, and representation will strongly impact the specific shape of this space and thereby the learning efficiency of the resulting QML model.
