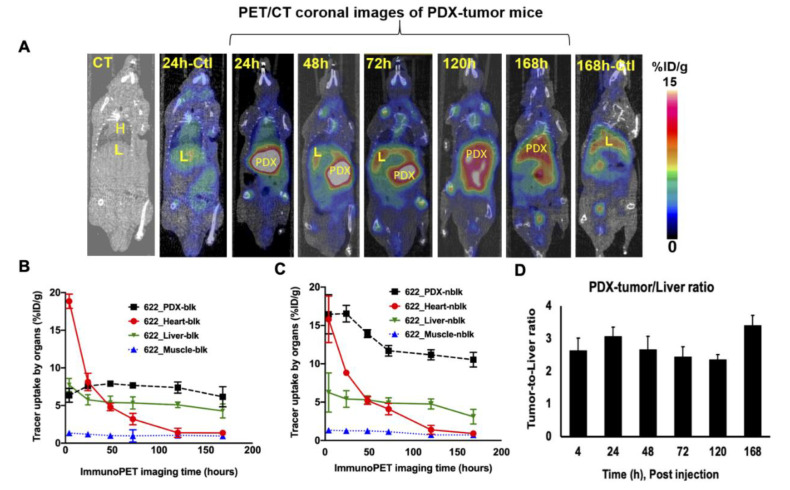
Figure 3.
PET/CT coronal images of 89Zr-Df-H3K3 in PDX-NSG and control mice. (A) PET/CT coronal images from PDX-NSG at various time points (24, 48, 120, 72, and 168 h p.i.) after administration of 89Zr-Df-H3K3. PET/CT or CT images of control group are also shown (at 24 h and 168 h p.i.) for comparison. Data were computed as mean ± SD %ID/g (n = 4) from ROI of non-tumor bearing liver from control group. (B,C) Time-activity curves of 89Zr-Df-H3K3 uptake into the PDX, heart, liver and muscle in the (B) blocking and (C) non-blocking mice groups were computed as ROI from the PET images. (D) PDX-to-liver ratio of non-blocking mice at various time points were computed from ROI data. Tracer uptake are decay corrected and presented as mean ± SD %ID/g.

