
Figure 10.
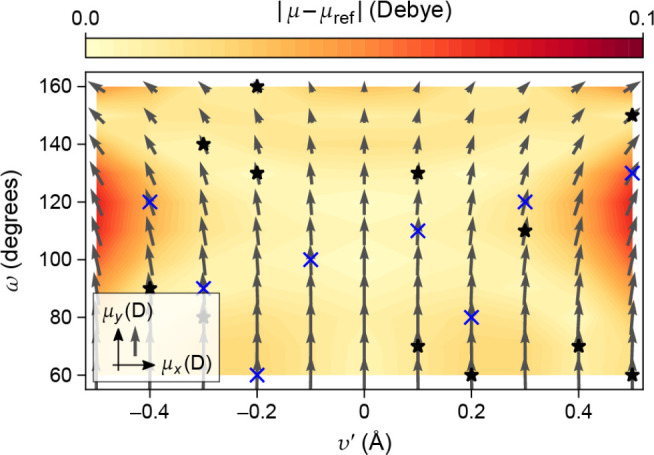
SA-GPR predictions of the dipole moment for the water molecule. The training data were generated using the Partridge–Schwenke model; the definition of the coordinates ν′ and ω, as well as the molecular structures, are the same as in Figure 8. Blue crosses and black stars indicate the representative and training point locations, respectively. Arrows indicate the magnitude and direction of the predicted dipole moment for each structure (the y axis corresponds to the C2 axis of the ideal molecule), and the background color scale indicates the magnitude of the model error. For reference, the typical scale of the dipole moment of a water molecule is 1.8 D (corresponding to the size of the gray arrow in the inset), and so the fitting errors are on the order of a few percent.