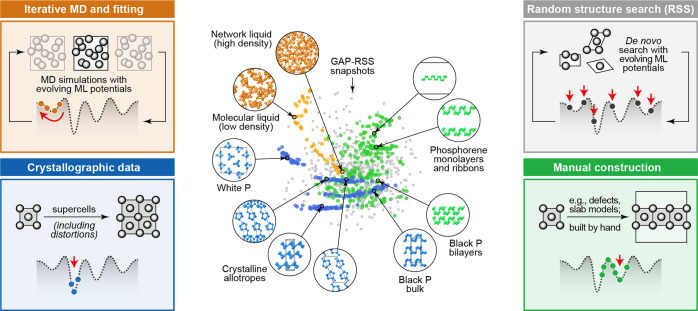
Figure 16.
Different strategies for constructing reference databases for ML potentials, indicated by cartoons in the boxes. The center of the figure shows a database of phosphorus configurations used to fit a general-purpose GAP for this element. The structural map, visualizing the (dis-) similarity between different configurations, illustrates the connection between random structure search (gray), exploration with the potential using MD (orange), and manual database building (blue, green). Adapted from ref (163). Original figure published under the CC BY 4.0 license (https://creativecommons.org/licenses/by/4.0/).

