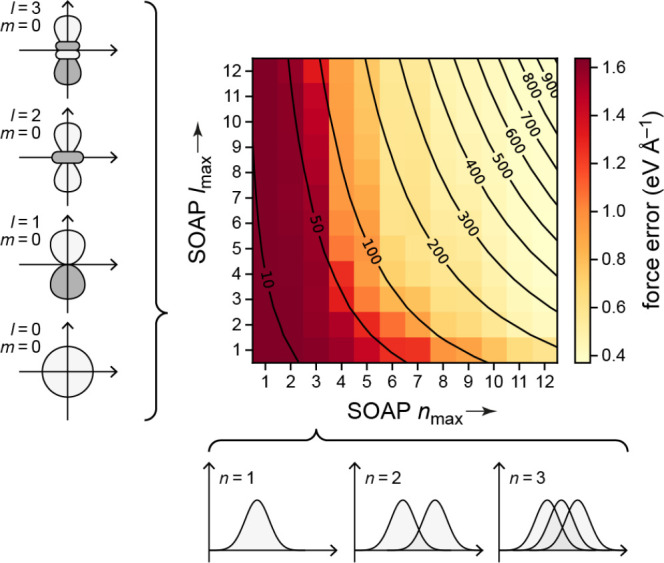
Figure 22.

Performance of a SOAP-GAP fit to a database of carbon configurations, as a function of the number of maximum radial (n) and angular (l) components in the SOAP kernel.152 The color map indicates the force error. Here, the black contour lines approximately indicate parameter choices resulting in equal length SOAP descriptor vectors, corresponding to roughly equal computational cost of prediction. Schematic drawings illustrate the role of the different functions that are affected by the lmax (angular functions) and nmax (radial functions) convergence parameters, respectively; the equidistant Gaussians that are shown in the lower part of the figure are subsequently orthogonalized in the construction of the SOAP kernel.52 Drawn with data from ref (152).
