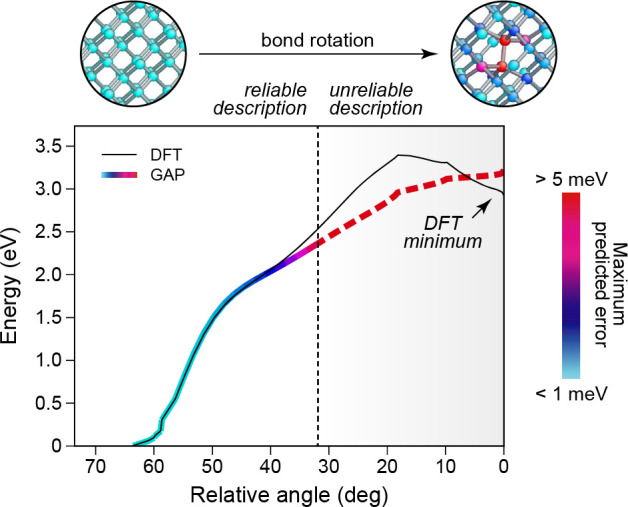
Figure 24.

Predicted errors of a GAP model. The figure shows the energetics of the pathway leading from perfect diamond-type silicon (left) to the formation of a 4-fold defect (right); the color of the curve corresponds to the largest predicted atomic energy error in the simulation cell, given by the Bayesian error estimate. For small distortions, the GAP prediction is in practically quantitative agreement with a DFT reference (show as thin black line); for larger distortions, roughly to the right of the dashed vertical line, the prediction deviates from the DFT result, and concomitantly the predicted error rises notably. Note that DFT predicts the 4-fold defect as a local minimum (highlighted by an arrow), whereas the GAP does not. Adapted from ref (139), where details, as well as other example cases, may be found. Original figure published under the CC BY 4.0 license (https://creativecommons.org/licenses/by/4.0/).
