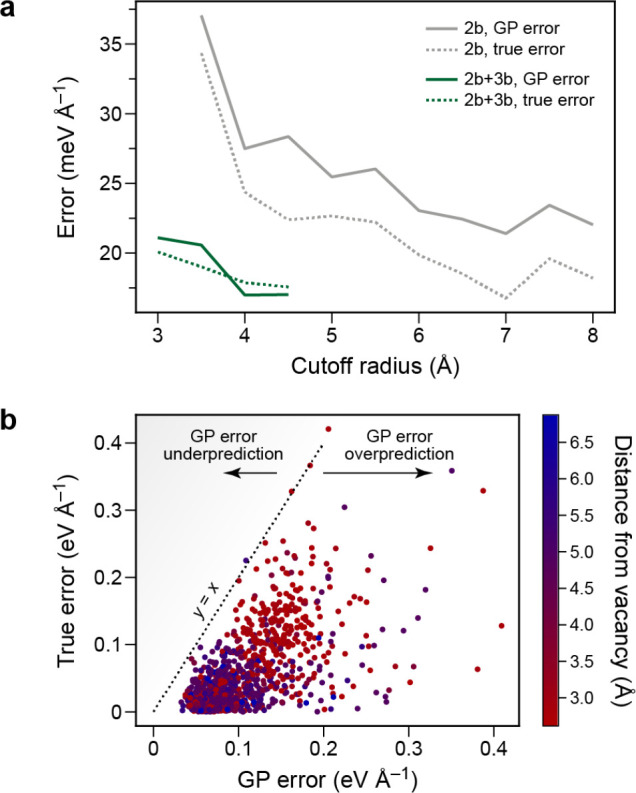
Figure 26.

Relationship between true and predicted errors for low-dimensional GPR models. (a) GP model errors for bulk fcc aluminum for a 2-body (“2b”) and a combined 2b+3b model, as a function of the cutoff radius of the model. (b) True versus predicted model error (for a 2b+3b model) for atomic configurations near a vacancy, with the distance of each individual atom from the vacancy indicated by color. Drawn with data from ref (61).
