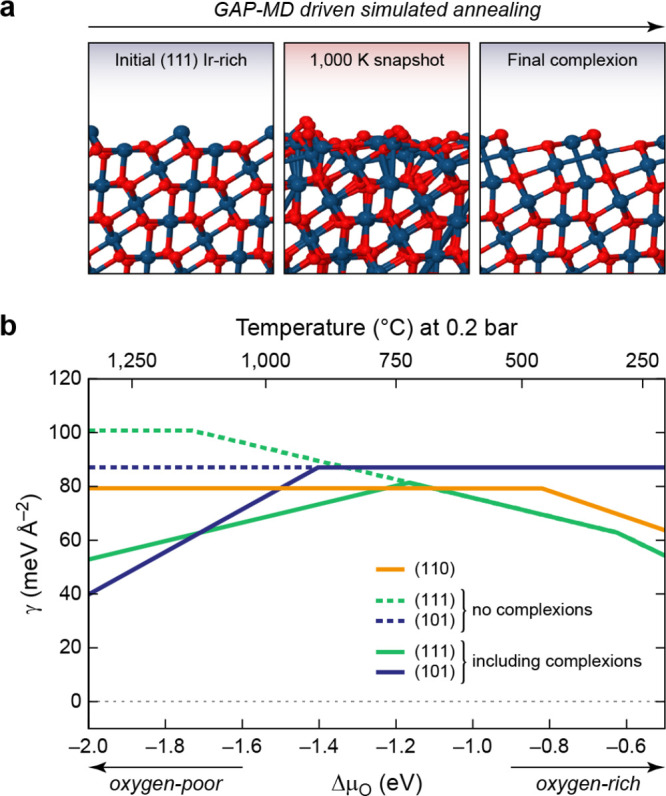
Figure 35.

Modeling oxide surfaces with GAP. (a) Surface complexions for the (111) surface of IrO2, showing the initial structure, a snapshot at 1000 K, and the final equilibrium structure after simulated annealing. Reprinted with permission from ref (308). Copyright 2020 by the American Physical Society. (b) Surface free energies, γ, as a function of oxygen chemical potential, ΔμO, for three different surfaces. Dashed lines indicate the surface free energies obtained without complexions. Adapted from ref (308). Original work copyright 2020 by the American Physical Society.
