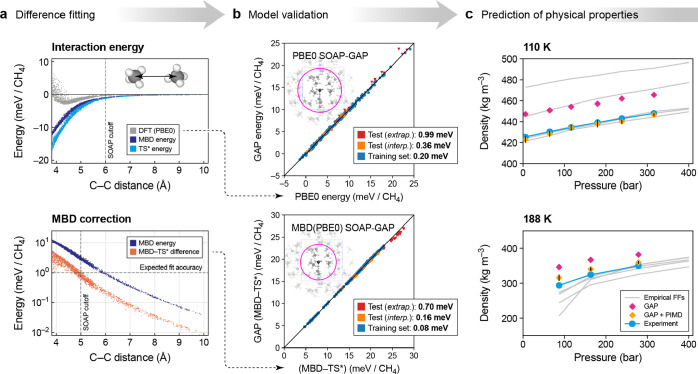
Figure 38.
Hierarchical GAP model for fluid methane (CH4). (a) Different terms in the interaction energy of a pair of methane molecules (geometries obtained from the condensed phase), with the top panel showing the PBE0 and MBD energy as well as the TS correction using a fixed Hirshfeld volume (denoted TS*). The bottom panel shows the MBD energy on a logarithmic scale as well as the difference between MBD and TS*. (b) Two SOAP-GAP models are fitted separately to reproduce the PBE0 interaction energy and the MBD-TS* difference. The panels show the validation of the interaction models against their respective references. Numerical errors are given in the legends. (c) Prediction of physical properties, here shown for the density–pressure isotherms, comparing the performance of the GAP (magenta, without; yellow, with path-integral MD to model quantum nuclear effects) with experimental data (cyan); the results of various empirical force fields are indicated by gray lines; the black bars indicate the size of statistical error. Details are given in ref (172). Adapted with permission from ref (172). Copyright 2019 American Chemical Society.

