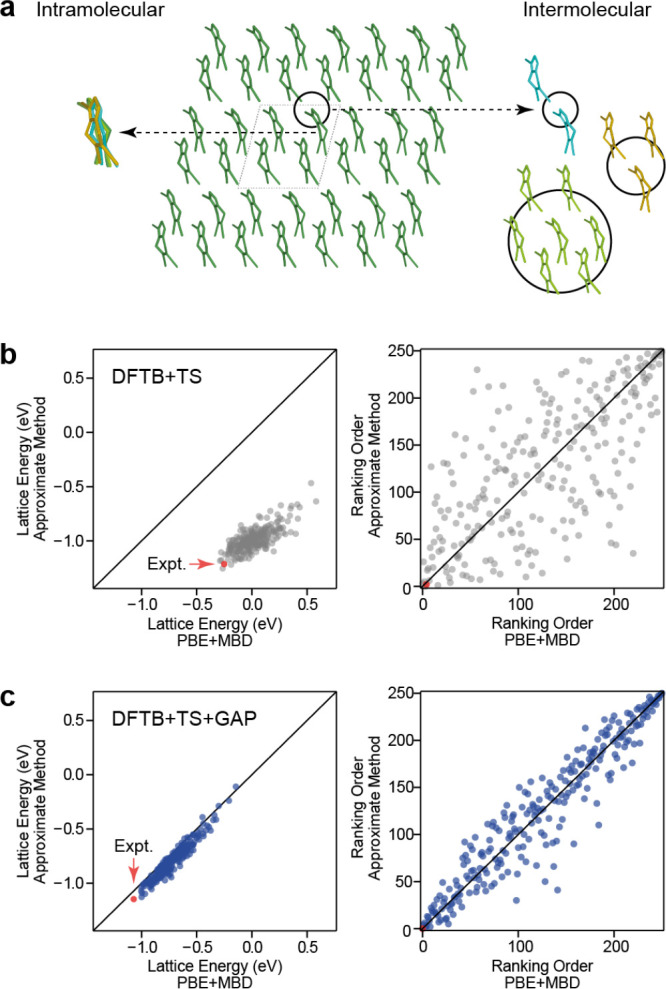
Figure 39.

GAP models for molecular crystal-structure prediction. (a) Illustration of the hierarchical construction of the ML model. Intramolecular and intermolecular terms are fitted independently, and both are difference models with DFT at the PBE+MBD level being the higher level of theory and the semiempirical DFTB+TS serving as the lower level baseline (cf. Figure 18a). The database of the intramolecular model consisted of isolated molecules, whereas that of the intermolecular model contained small clusters obtained from DFTB relaxations of crystals. The molecule shown is tricyano-1,4-dithiino[c]-isothiazole, which was target XXII in the sixth blind test of organic crystal-structure prediction.346 Results of independent crystal structure searches performed with the DFTB+TS baseline (panel b) and the DFTB+TS+GAP model (panel c) on lattice energies (left) and rank order (right), with respect to the PBE+MBD reference (computed without further relaxation). The red dot indicates the experimentally found crystal structure. The large overall shift in the DFTB+TS energies is due to the incorrect monomer geometry of the baseline model. Reprinted from ref (175); original figures published under the CC BY-NC 3.0 license (https://creativecommons.org/licenses/by-nc/3.0/).
