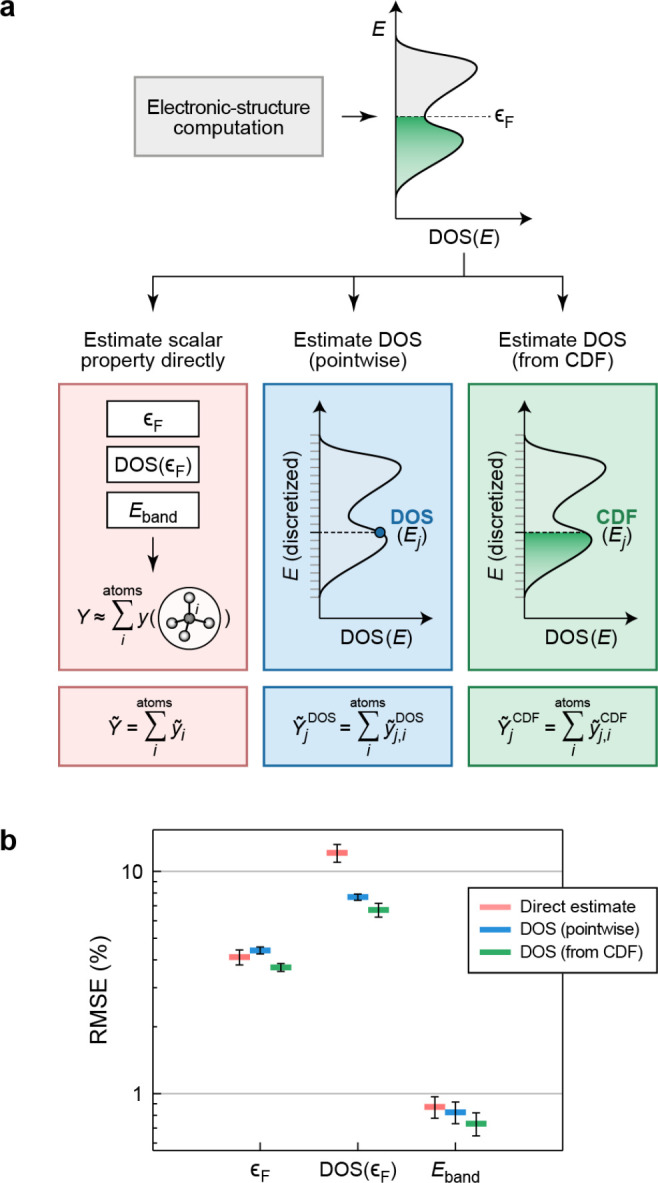
Figure 44.

(a) Machine learning the electronic density of states (DOS) in the framework of GPR. Three approaches for estimating properties Y are shown in a highly schematic way: these properties could be scalar properties derived from the DOS (red), values of the DOS itself on a discrete grid of energy values (blue), or values of the cumulative distribution function (CDF; green); see text for details. (b) Average errors for the prediction of quantities that can be computed from the electronic DOS in amorphous silicon,212 either directly (red) or using two different representations of the DOS curves: the pointwise approach (blue) and that obtained by differentiating the CDF (green). The error bars represent the standard error of the mean. Errors are expressed as percentage of the intrinsic variability within the dataset. Drawn with data from ref (212).
