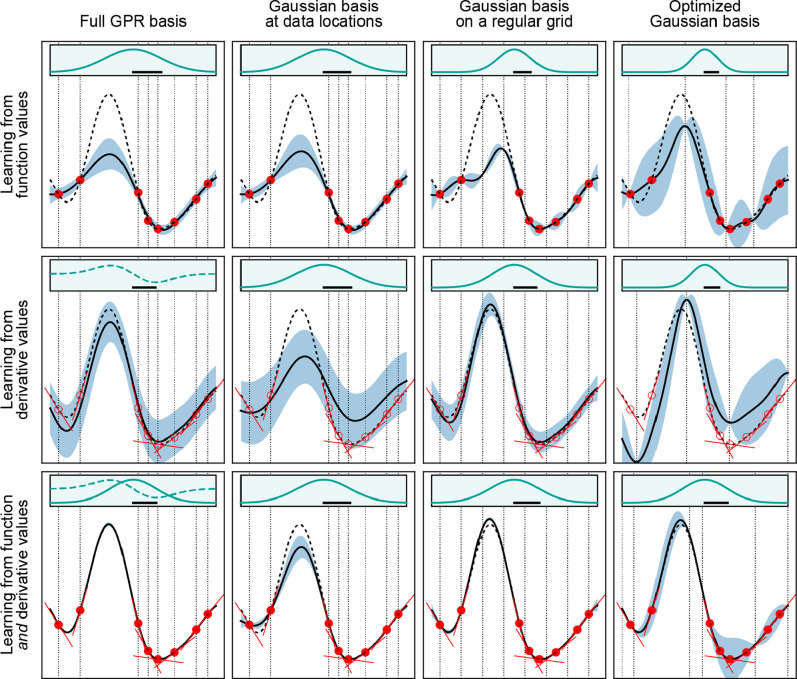
Figure 6.
Effects of different types of data and basis functions on GPR fits. These are illustrated using the same example function as in Figure 2 (black dashed lines), showing the predicted mean (black solid lines) and variance (light blue shaded area) of the fit. Observations are indicated by the red points for values and short red line segments for derivatives. The fitting data included only function values in the first row, only derivative values in the second row, and both function and derivative values in the bottom row. Full GPR was used for the data shown in the first column, and sparse GPR for those in the others. Representative point locations (vertical dotted lines) coincide with the data point locations for the first and second columns, whereas they were placed at regular intervals for the third column. In the fourth column, the number and location of representative points were optimized to maximize the marginal likelihood. The regularization hyperparameter σ as well as the length-scale hyperparameter σlength were independently optimized for each panel to maximize the marginal likelihood. Insets show the kernel basis functions used in the fit (solid for Gaussians; dashed for Gaussian derivatives); scale bars represent the optimized values of σlength.

