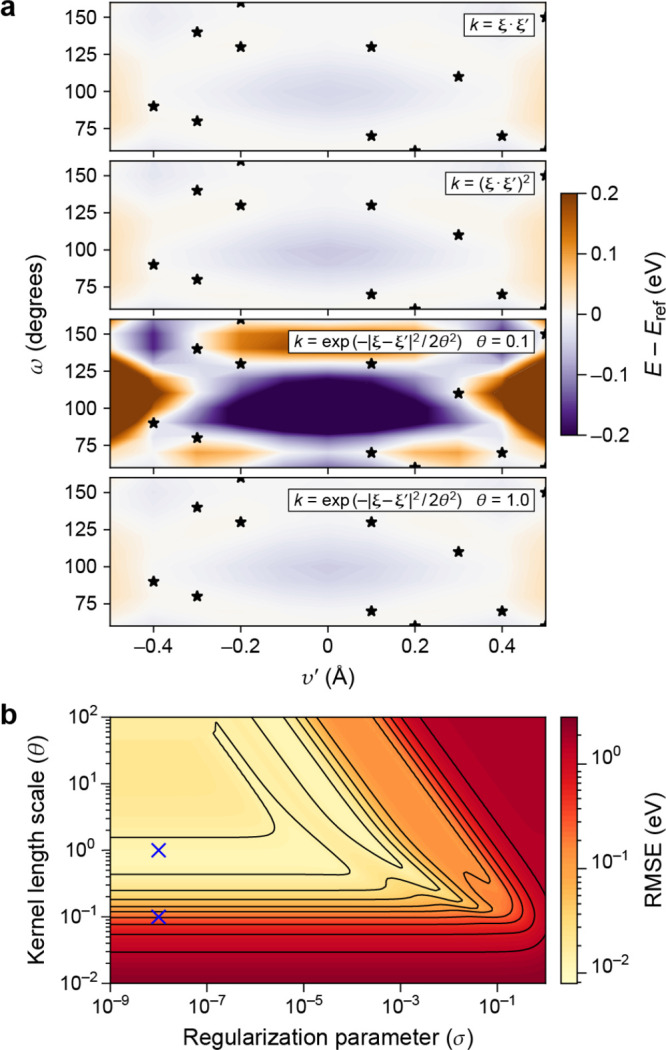
Figure 9.

Effect of different kernels and hyperparameters for the H2O example. (a) Error in predicting the energy for the distorted H2O molecule using different kernels as noted in the legends. Stars denote the training point locations. For all kernels, the features, ξ, are the SOAP power spectrum components, centered on the oxygen atom, with σa = 0.5 Å and regularization σ2 = 10–8. (b) Test-set RMSE for the H2O energy model based on a Gaussian kernel, as a function of the regularization σ and the kernel length scale θ. The two blue crosses correspond to the hyperparameters used in the lower two graphs in panel a.
