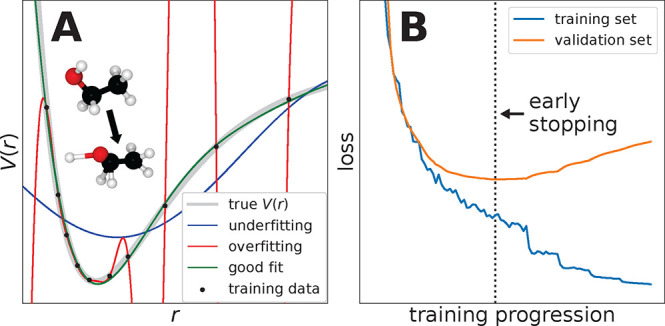
Figure 17.

(A) One-dimensional cut through a PES predicted by different ML models. The overfitted model (red line) reproduces the training data (black dots) faithfully, but oscillates wildly in between reference points, leading to “holes” (spurious minima) on the PES. During an MD simulation, trajectories may become trapped in these regions and produce unphysical structures (inset). The properly regularized model (green line) may not reproduce all training points exactly, but fits the true PES (gray line) well, even in regions where no training data is present. However, too much regularization may lead to underfitting (blue line), that is, the model becomes unable to reproduce the training data at all. (B) Typical progress of the loss measured on the training set (blue) and on the validation set (orange) during the training of a neural network. While the training loss decreases throughout the training process, the validation loss saturates and eventually increases again, which indicates that the model starts to overfit. To prevent overfitting, the training can be stopped early once the minimum of the validation loss is reached (dotted vertical line).
