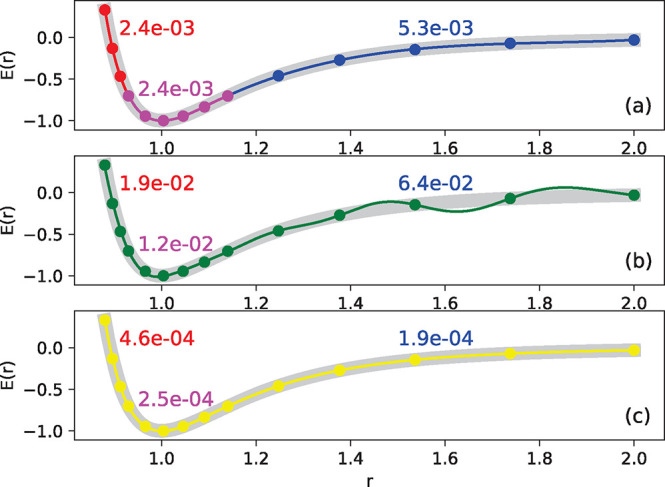
Figure 21.

Lennard-Jones potential (thick gray line) predicted by KRR with a Gaussian kernel. (a) Potential energy is decomposed into short- (red), middle- (magenta), and long-range (blue) parts, which are learned by separate models (symbols show the training data and solid lines the model predictions). The mean squared prediction errors (in arbitrary units) for the respective regions are shown in the corresponding colors. (b) Entire potential is learned by a single model using the same training points (green). All models in panels a and b use r as the structural descriptor. (c) Single model learning the potential, but using r–1 as structural descriptor (yellow). The mean squared errors (a.u.) for different parts of the potential in panels b and c are reported independently to allow direct comparison with the values reported in panel a.
