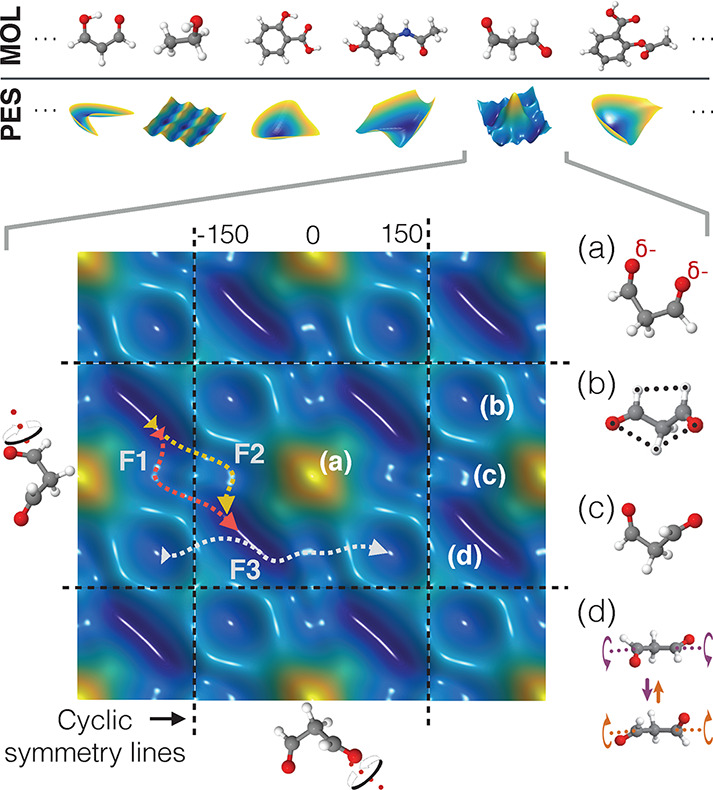
Figure 3.

Top: Two-dimensional projections of the PESs of different molecules, highlighting rich topological differences and various possible shapes. Bottom: Cut through the PES of keto-malondialdehyde for rotations of the two aldehyde groups. Note that the shape repeats periodically for full rotations. Regions with low potential energy are drawn in blue and high energy regions in yellow. Structure (a) leads to a steep increase in energy due to the proximity of the two oxygen atoms carrying negative partial charges. Local minima of the PES are shown in (b) and (c), whereas (d) displays structural fluctuations around the global minimum. By running molecular dynamics simulations, the most common transition paths (F1, F2, and F3) between the different minima could be revealed.
