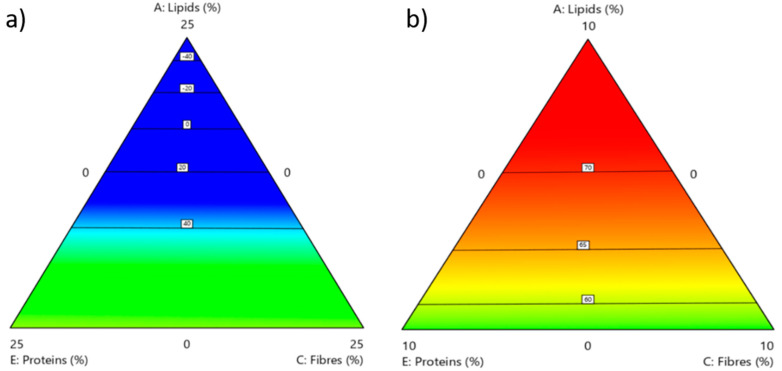
Figure 6.
Graphical model variation of the amount of lysine in the proteins of BSF prepupae in relation to the composition of the rearing substrate in terms of lipids, protein and fibre, considering two scenarios: (a) carbohydrates = 75 wt%; (b) carbohydrates = 90 wt%. The region representing the highest value of the response is shown in red colour, whereas the lowest values are in blue. For each response, the most significant factor has been considered for the graphical model, expecting higher variation in the response behaviour.

