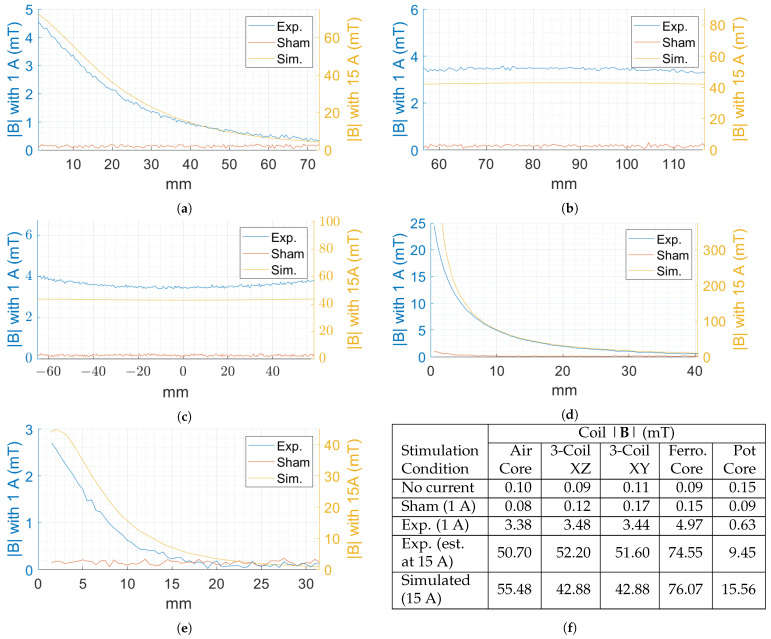
Figure 5.
Line scans showing the experimental, sham, and simulated |B| along the red line depicted in the corresponding distribution images of Figure 4 for the (a) air core coil; (b) three-axis XZ; (c) three-axis XY, (d) ferromagnetic core coil; and (e) pot core coil scans. Experimental measurements were performed under a 1 A stimulation, simulated measurements were performed with 15 A, and the left and right axes of the graphs show the relationship between the |B| for a 1 A and 15 A stimulation, respectively; (f) summary of the |B| for the control, sham, experimental, and simulated conditions. Additionally, estimations of the |B| for each coil under a 15 A stimulation are included by linearly scaling the results from a 1 A stimulation by a factor of 15. Measurements are from a distance 10 mm from the coil along the central axis for the air, ferromagnetic, and pot core coils and at the center for the three-coil system.

