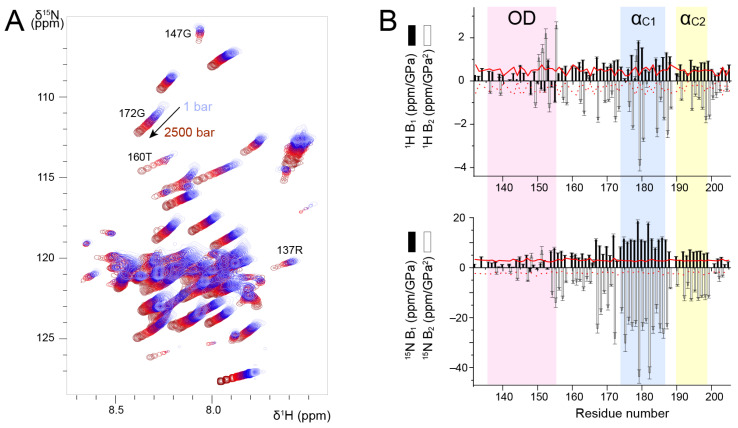
Figure 4.
Discrimination between stably associated and isolated helices in RSV P127–205 by variable pressure NMR experiments. (A) Overlay of 1H-15N HSQC spectra of P127–205 acquired by increasing pressure from 1 to 2500 bar. NMR data were recorded at 600 MHz 1H Larmor frequency. The temperature was 313 K. (B) First and second order pressure coefficients, B1 and B2, were determined by fitting 1H and 15N chemical shift variations as a function of pressure to a second-order polynomial according to δ(P) − δ(P0) = B1 × (P − P0) + B2 × (P − P0)2, and plotted with bar diagrams. Reference values for random coil conformation (taken from [60]) were plotted as red lines (B1, solid line) and (B2, dotted line).

