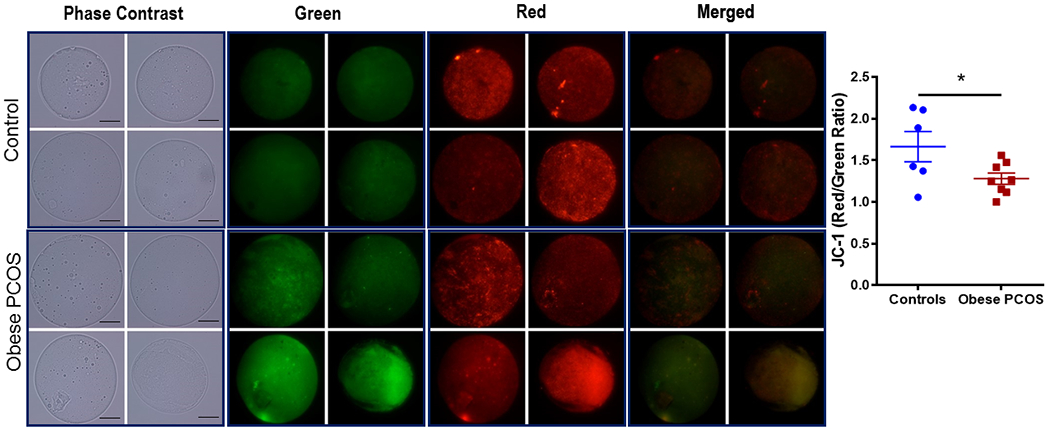
Figure 4.

Inner Mitochondrial Membrane Potential: Pictorial representation of oocytes from control (above) and obese PCOS (below) mice. Brightfield microscopy, followed by green fluorescence, red fluorescence, and finally merged using JC-1 dye at 60x magnification. The obese PCOS mice show a lower red: green ratio, and therefore lower IMM potential compared to controls, 2-5 oocytes/mice. * p<0.05, n=6 controls and 8 obese PCOS, scale bar =20μm.
