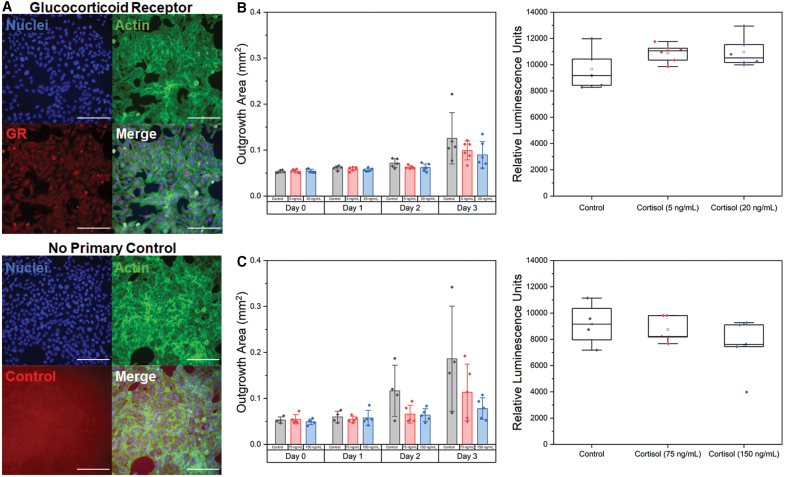
FIG. 4.
The effects of cortisol on trophoblast motility. (A) Representative fluorescent images of HTR-8/SVneo trophoblast cells cultured in 6-well plates. HTR-8/SVneo trophoblast cells express glucocorticoid receptors with cytoplasmic staining. The no primary control showed only minimal background fluorescence with no indication of nonspecific binding. Green: Phalloidin (actin). Red: Antiglucocorticoid receptor. Blue: Hoechst (nuclei). (B) Total outgrowth area at days 0–3 and cell viability at day 3 for control, 5 ng/mL cortisol, or 20 ng/mL cortisol. Data presented as mean ± standard deviation with individual data points shown. (C) Total outgrowth area at days 0–3 and cell viability at day 3 for control, 75 ng/mL cortisol, or 150 ng/mL cortisol. Data presented as box plots with individual data points shown. n = 4–6 samples per condition. Scale: 200 μm. Color images are available online.

