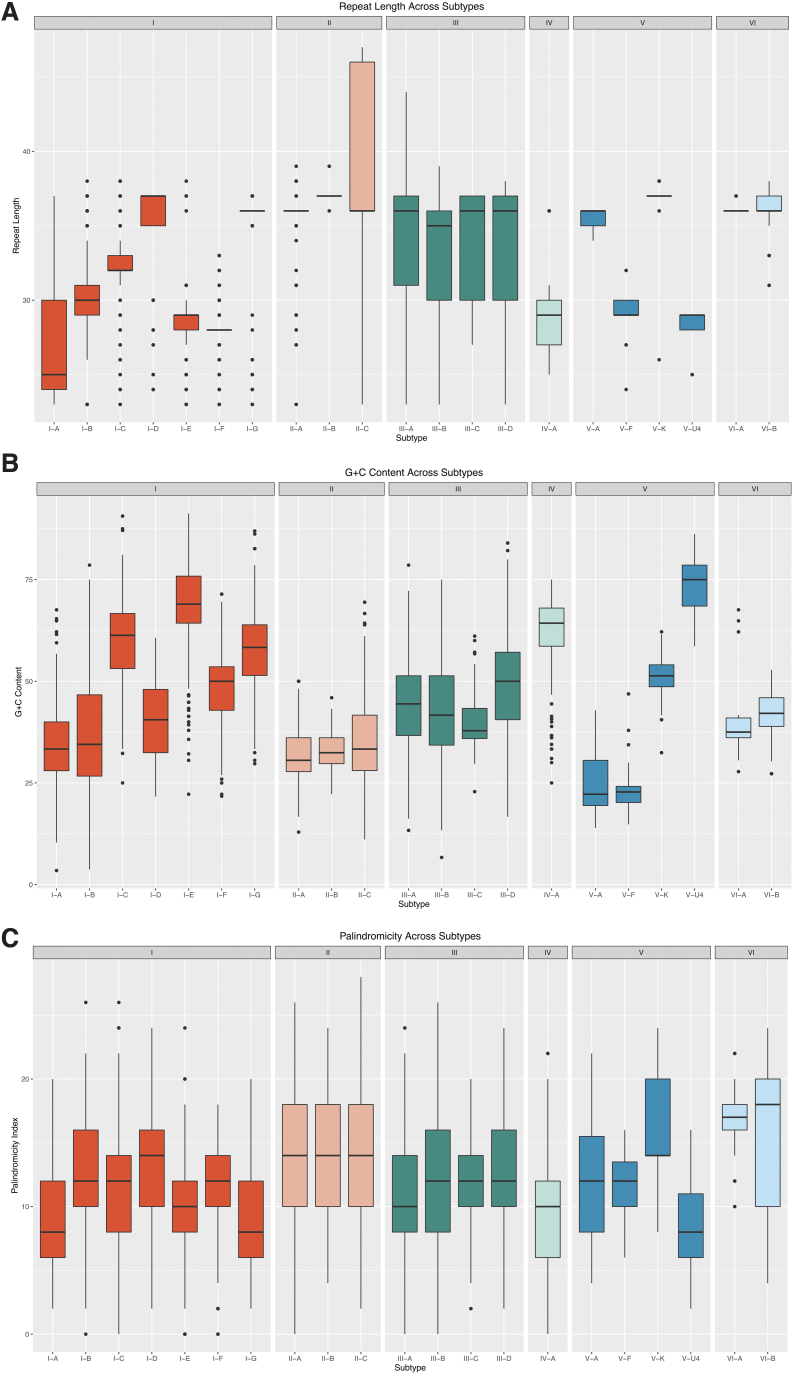
FIG. 4.
Distribution of biological features by subtype. Box plots of repeat length (A), GC content (B), and palindromicity index (C) are shown for repeats in the training set. Repeat length, GC content, and palindromicity index display the widest variability across type I and type V repeats, while the median of these features is more conserved within type II and type III repeats.

