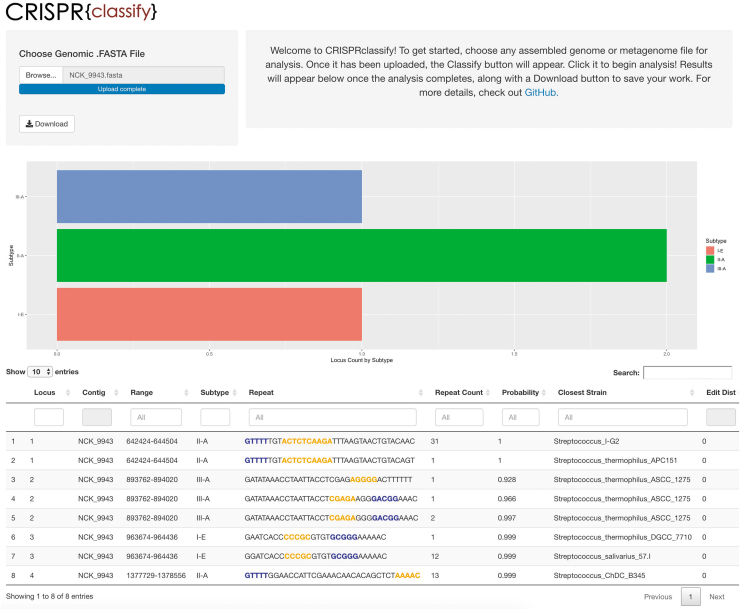
FIG. 5.
Overview of the web interface of CRISPRclassify. Locus counts are displayed by subtype, and distinct repeats are listed by locus, along with predicted subtype and corresponding probability. High-gain k-mers are highlighted in the repeat sequence either in blue, indicating forward orientation, or in yellow, indicating the reverse complement. The strain with the closest matching repeat from the training data set is calculated and listed as “Closest Strain,” along with the corresponding number of single nucleotide polymorphisms between the repeats (Edit Dist).

