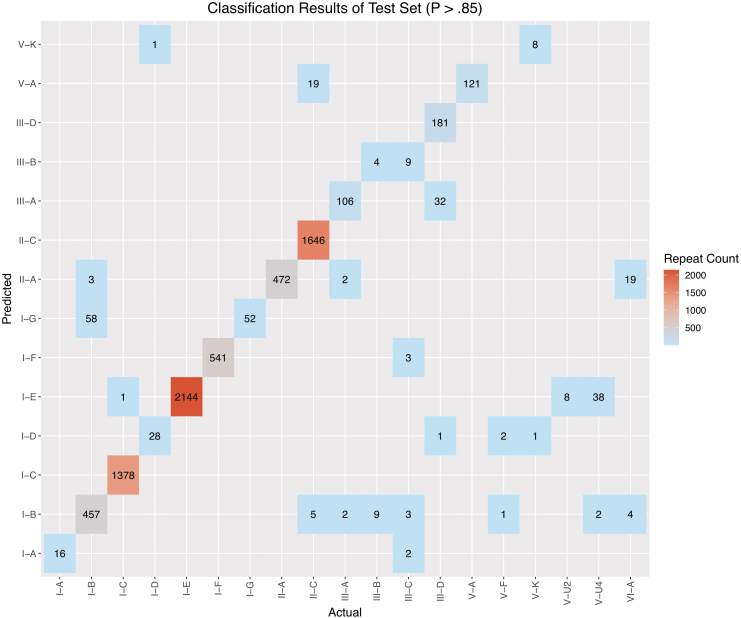
FIG. 7.
Benchmarking result counts for the test set. Cas-based locus classification results (Actual) are plotted against CRISPRclassify predictions (Predicted). Subtypes with the most misclassified loci were I-B (61 false-negatives), V-U4 (40 false-negatives), II-C (24 false-negatives), and VI-A (23 false-negatives). The overall F1 score for the high confidence predictions (p > 0.85) of the test set is 0.97.

