
Figure 5.
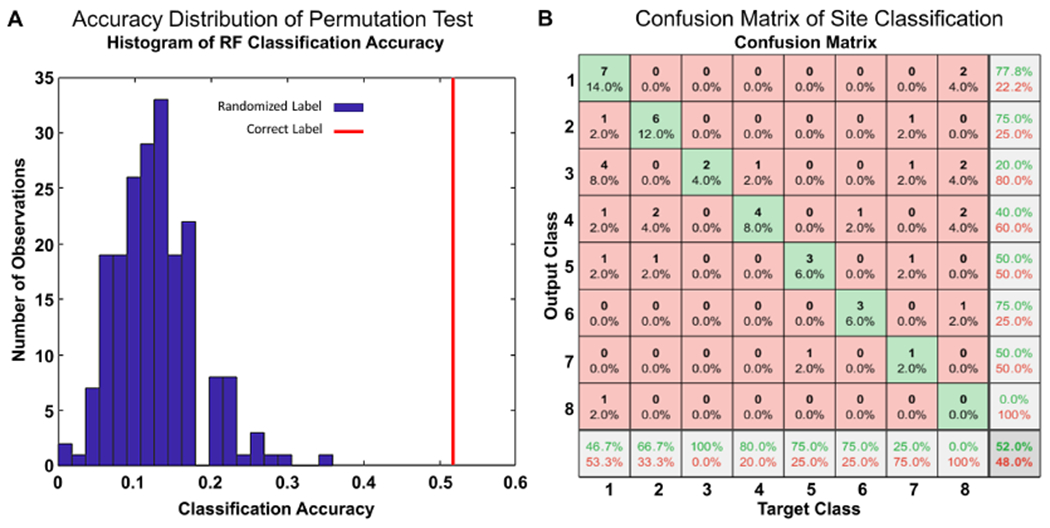
Statistical analysis of batch effect presence. (A) Histogram showing accuracy distribution of RF classifiers trained with randomized site labels (blue bins) from a permutation test. The accuracy of a RF classifier trained with correct labels is highlighted on the figure in red. (B) Confusion matrix illustrating RF predicted sites of the n = 50 testing cohort; rows correspond to the predicted class (output class) and columns to true class (target class). Diagonal cells correspond to observations that are correctly classified. Both the number of observations and the percentage of the total number of observations are shown in each cell. The last column shows the precision, or positive predictive value, in green. The bottom row shows the recall, or true positive rate, in green. The bottom right cell shows the overall accuracy. Sites S2 (recall = 66.7%), S3 (recall = 100%), S4 (recall = 80%), S5 (recall = 75%), S6 (recall = 75%) can be seen to have high recall values, driving the overall accuracy of the classifier, and demonstrating the presence of detectable batch effects.