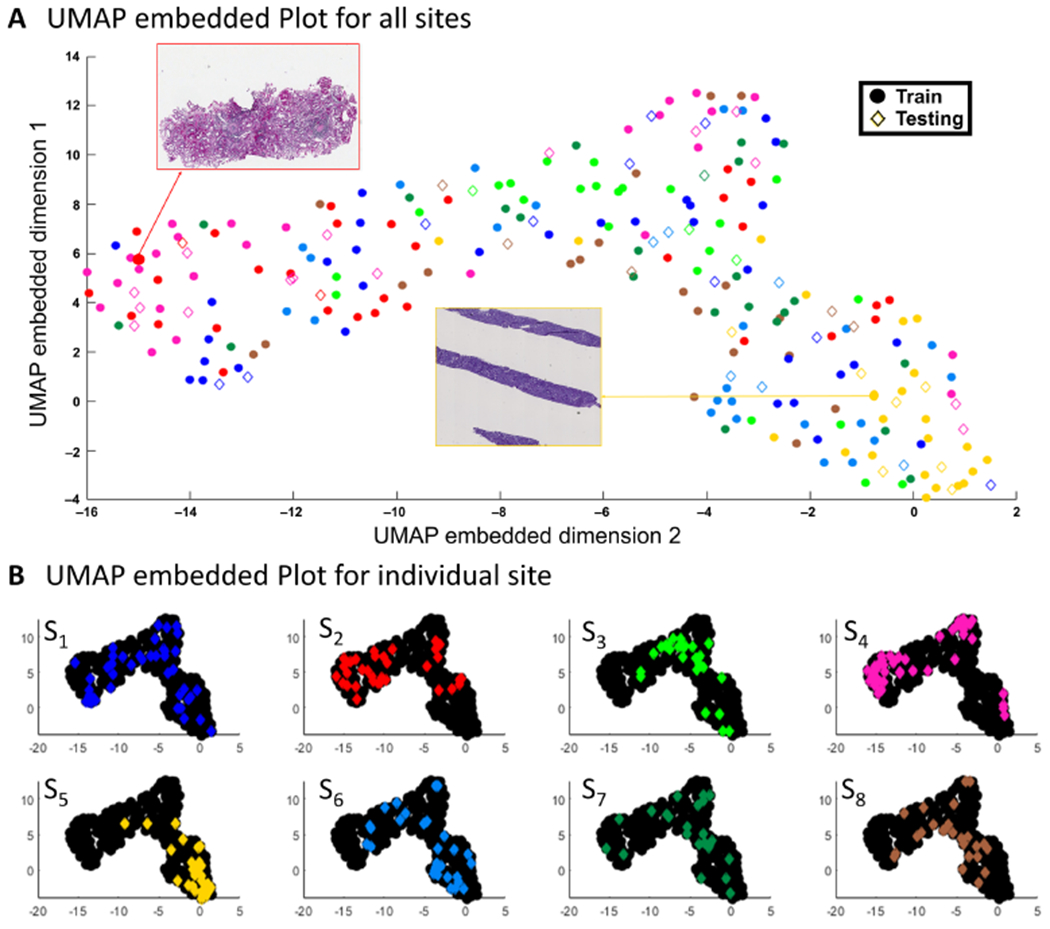
Figure 6.

UMAP embedded plot for assessment of batch effects in NEPTUNE DPR. (A) Samples from eight sites plotted in the 2D embedded space produced by UMAP, where examples from left (red arrow, site S2) and right (yellow arrow, site S5) are shown, where circles represent cases from the training set and diamonds represent cases from the test set for all color pairs, with (B) the same sites shown in individual plots (with other laboratories in black) to highlight their distributions. The UMAP embedding was generated in an unsupervised manner, with the training and testing cases used in the RF experiment shown as circles and diamonds, respectively. These labels appear to cluster by originating WSI site well, indicating that training and testing samples are near each other in the high dimensional color space features computed by HistoQC. As can be observed, sites S2, S3, S4, S5 are demonstrating concise clusters, indicating the potential presence of batch effects. These findings are in line with observations from the confusion matrix in Figure 5B. Panel (A) further demonstrates that notable presentation differences are driving divergent locations on the plot, with the left WSI showing a higher red and lower blue channel intensity versus the WSI on the right having heavy contrast and a high intensity blue channel.
