Figure 1.
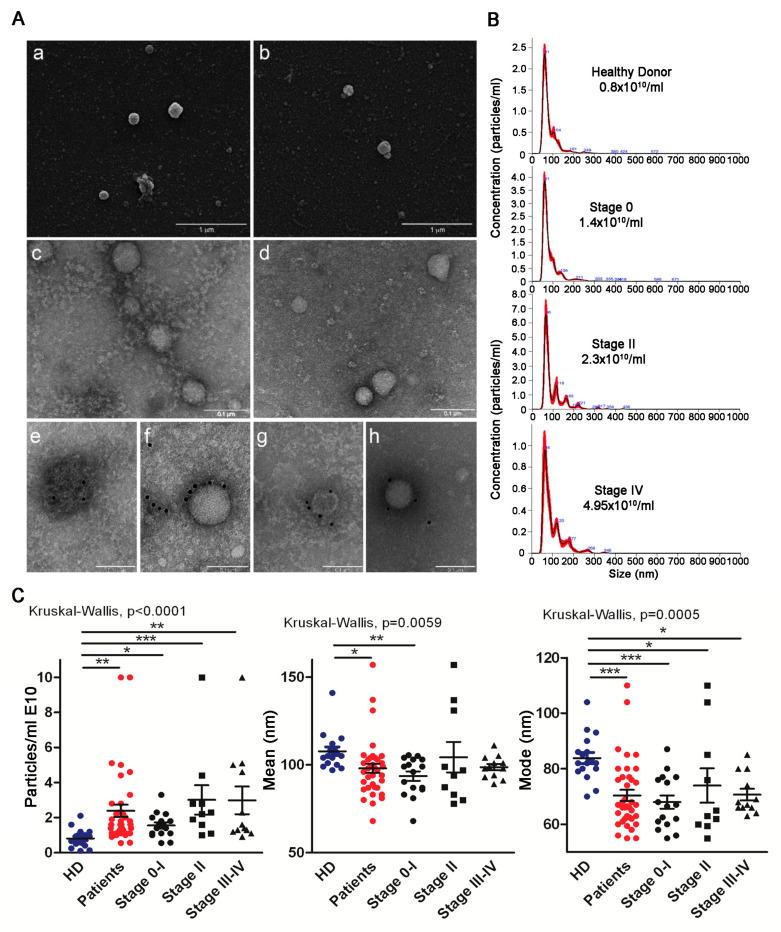
Morphology and nanoparticle tracking analysis (NTA) of total sEV. (A) Scanning electron microscopy analysis of total sEV from a HD (a), and from a stage II melanoma patient (b); bars, 1 µm. Transmission electron microscopy analysis of HD sEV (c) and stage II patients’ sEV (d); bars, 0.1 μm. (e–h) Immunoelectron microscopy combined with positive/negative contrast method: D sEV (e,f) and stage II patients’ sEV (g,h) showing the presence of CD81 (e,g) and tsg101 (f,h); bars, 0.1 µm. (B) Representative NTA profiles of HD and melanoma patients’ (stages 0, II, IV) sEVs. (C) NTA characterization of total sEV from HD and patients, with different stages of disease (particles/mL, mean and mode); HD n = 17; patients n = 38. Statistical significance was achieved with unpaired t-tests for HD vs. patients and with Kruskal–Wallis and Dunn post-tests for HD vs. stages. * p < 0.05, ** p < 0.001, *** p < 0.0001.

