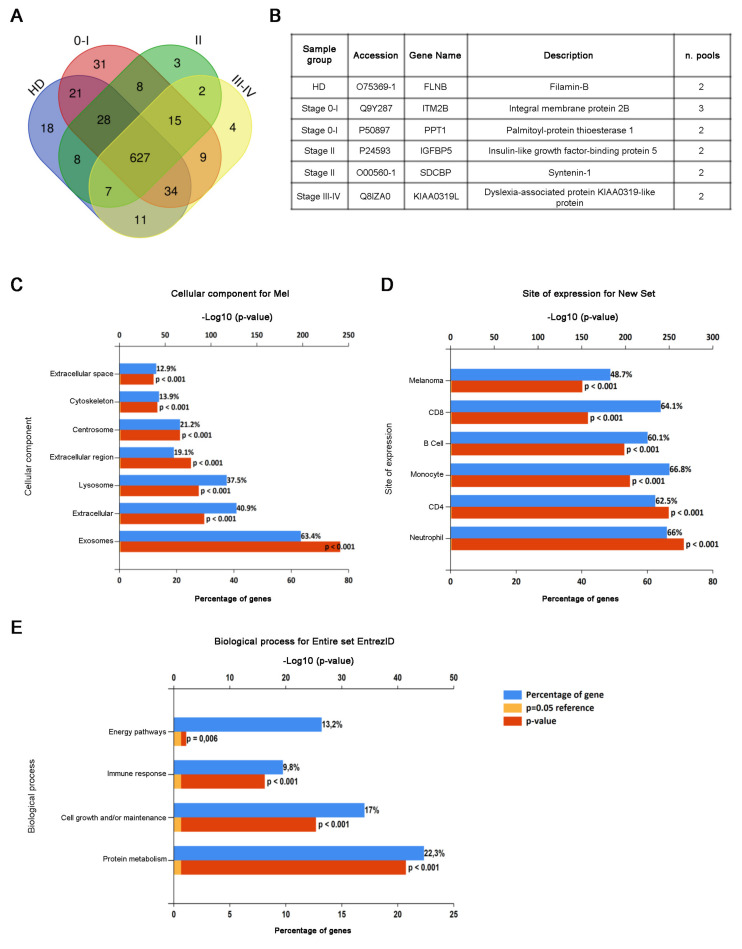
Figure 3.
Proteomic analysis of CD81sEV. (A) A Venn diagram representing the number of proteins uniquely detected in each HD, stage 0–I, stage II or stage III–IV group or shared among two, three or four-sample groups. (B) A table of proteins identified at least in two pools uniquely in one sample group. (C–E). Enrichment analysis of identified proteins by FunRich analysis for cellular component (C) site of expression (D) and biological process (E). Blue bars represent the percentages of protein genes assigned to the indicated terms. Yellow bars show the reference p value (0.05), and red bars show the calculated p value of enrichment for the indicated term.

