
Extended Data Fig. 6. Evaluating the predictive capacity and information overlap among the TGSig, SLE-Sig, and IFN-I-DCact signatures.
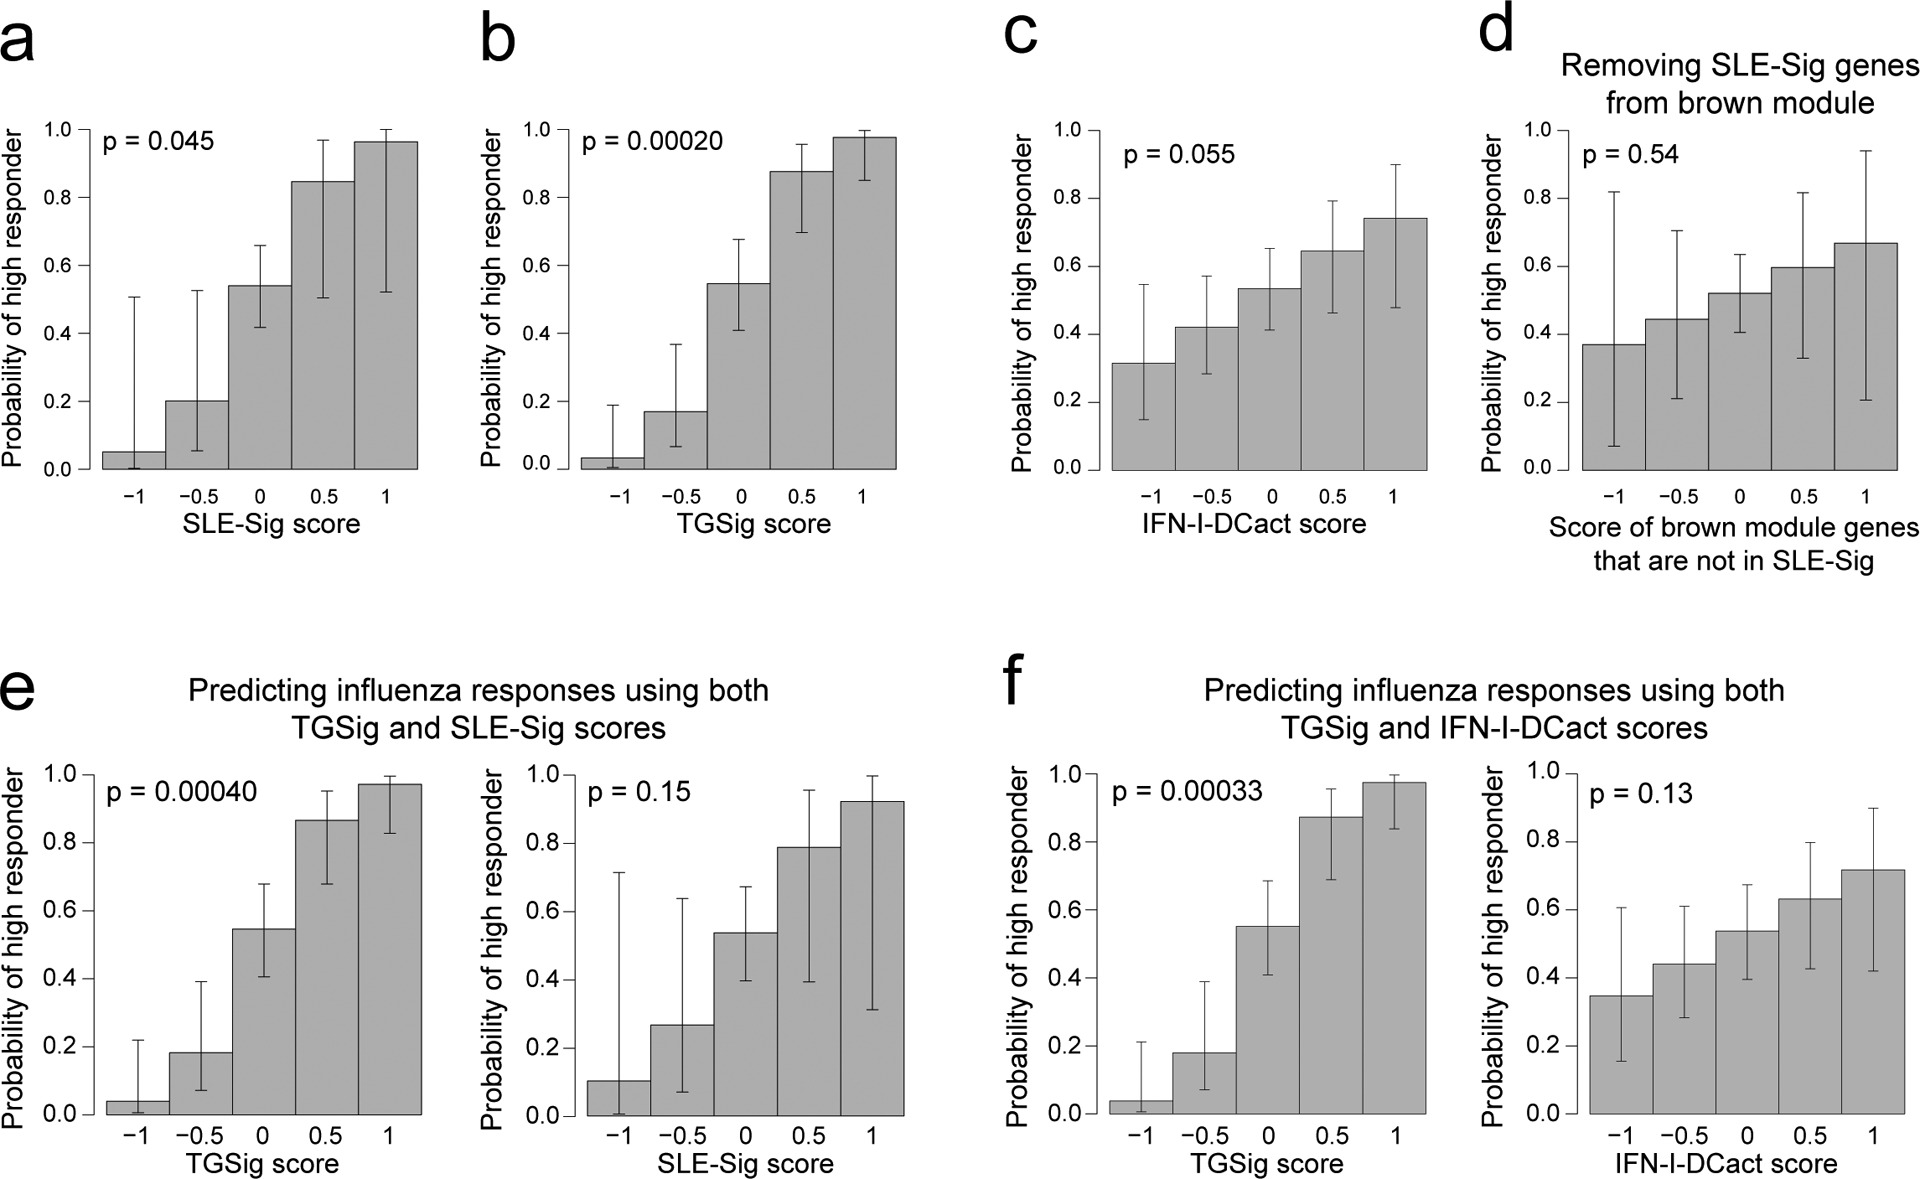
a-d, The predictive profile of SLE-Sig (Fig. 3e) (a), TGSig (b), IFN-I-DCact (Fig. 3f) (c), and the non-leading edge genes from the brown module (Fig. 3e) (d) used as the sole predictor in logistic regression models of high versus low influenza vaccination responder status. Influenza vaccination data pooled from four datasets (Stanford 2008, NIH 2009, Yale 2011, Yale 2012) were used (n = 71 high and low responders). Note that for the brown module (Fig. 3a–d), most of the predictive information come from the leading-edge genes since the signature score of genes outside of the leading edge is not predictive (shown in (d)). e, f when both TGSig and SLE-Sig were used as predictors in the logistic regression (e) or when both TGSig and IFN-I-DCact score were used as predictors (f). In these graphs, the predictor scores are shown on the x axis and the probability that a high responder falls within the predictor score bin is shown on the y axis. The error bars correspond to 95% CIs. The two-tailed p value indicates the probability that the coefficient (“effect”) of the term (e.g., TGSig score) in the logistic regression is 0.