
Extended Data Fig. 9. Evaluating CMV correlates and pDC surface expression phenotypes strongly influenced by genetics from ref.35 in high versus low responders.
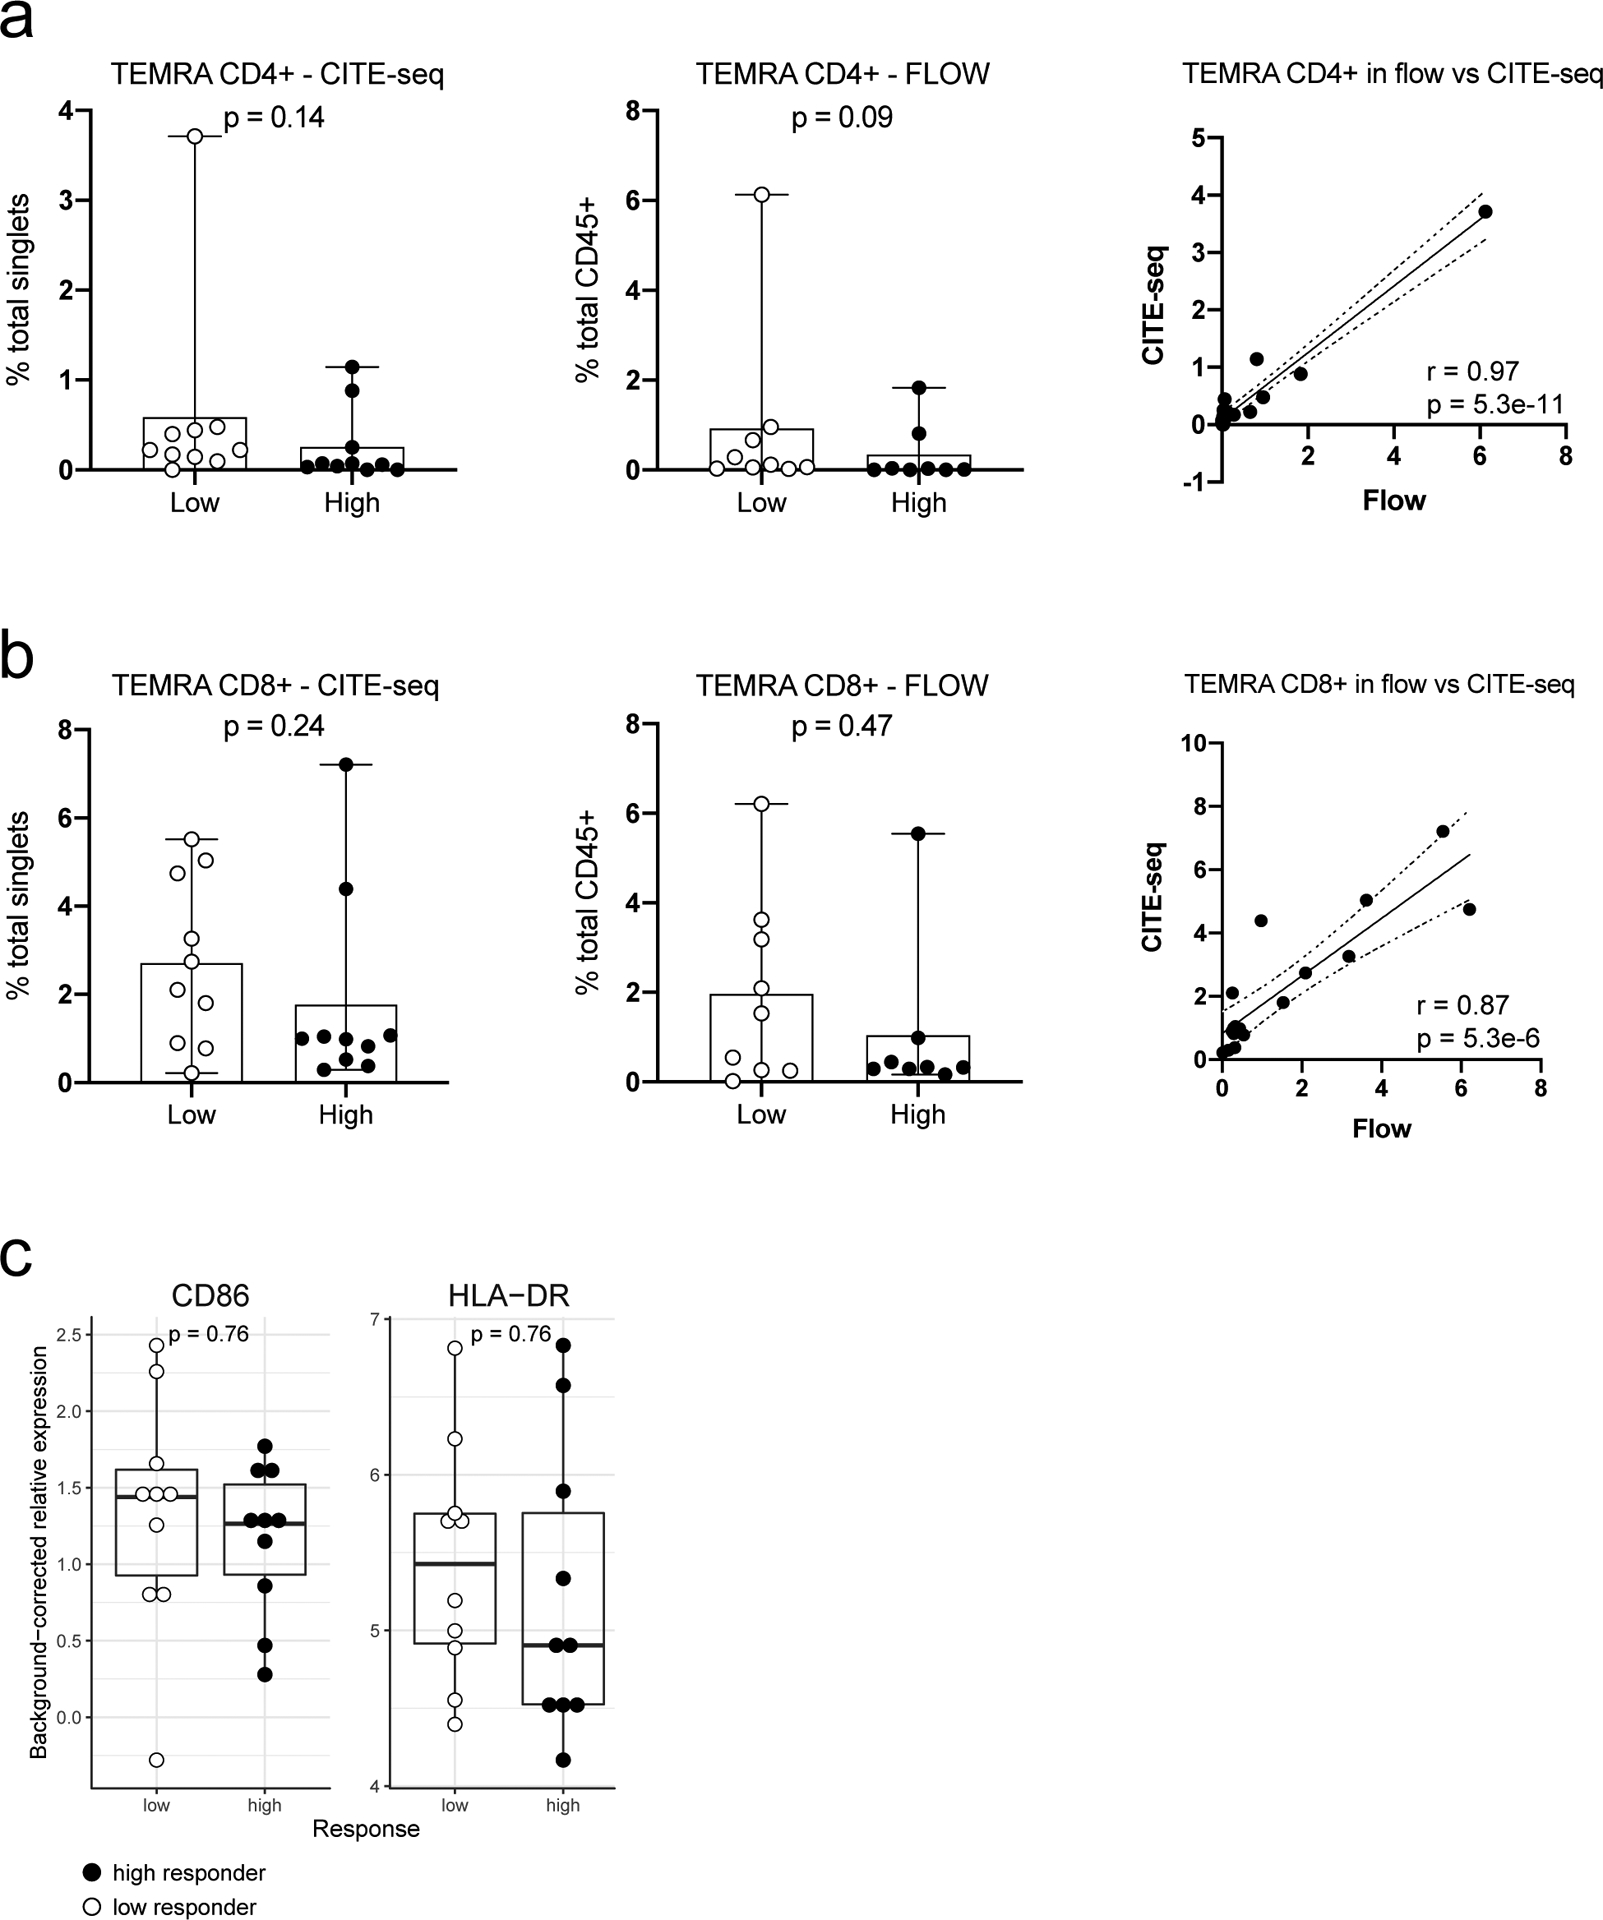
Since CMV status is not available for the cohorts we evaluated, we evaluated whether CMV correlates are significantly different between high and low responders in the NIH influenza vaccination cohort. a, Boxplots comparing the frequency of CD4+ TEMRA cells between 10 low and 10 high responders using CITE-seq (left panel) and between 9 low and 8 high responders using flow cytometry (center panel) data. Wilcoxon two-tailed p values are shown. The third panel is a scatter plot of CITE-seq versus the flow cytometry cell frequencies (n=17). Pearson correlation and two-tailed p values are shown. b, Same as (a) but for CD8+ TEMRA cells. c, Boxplots comparing the relative surface protein expression of CD86 and HLA-DR in pDCs (cluster C9) between 10 low and 10 high responders using CITE-seq data. Wilcoxon two-tailed p values are shown. For all boxplots the center line corresponds to the median value, lower and upper hinges correspond to the first and third quartiles (the 25th and 75th percentiles); lower and upper whiskers extend from the box to the smallest or largest value correspondingly, but no further than 1.5x inter-quantile range.