
Figure 5: Dissecting the cellular origin of baseline signatures.
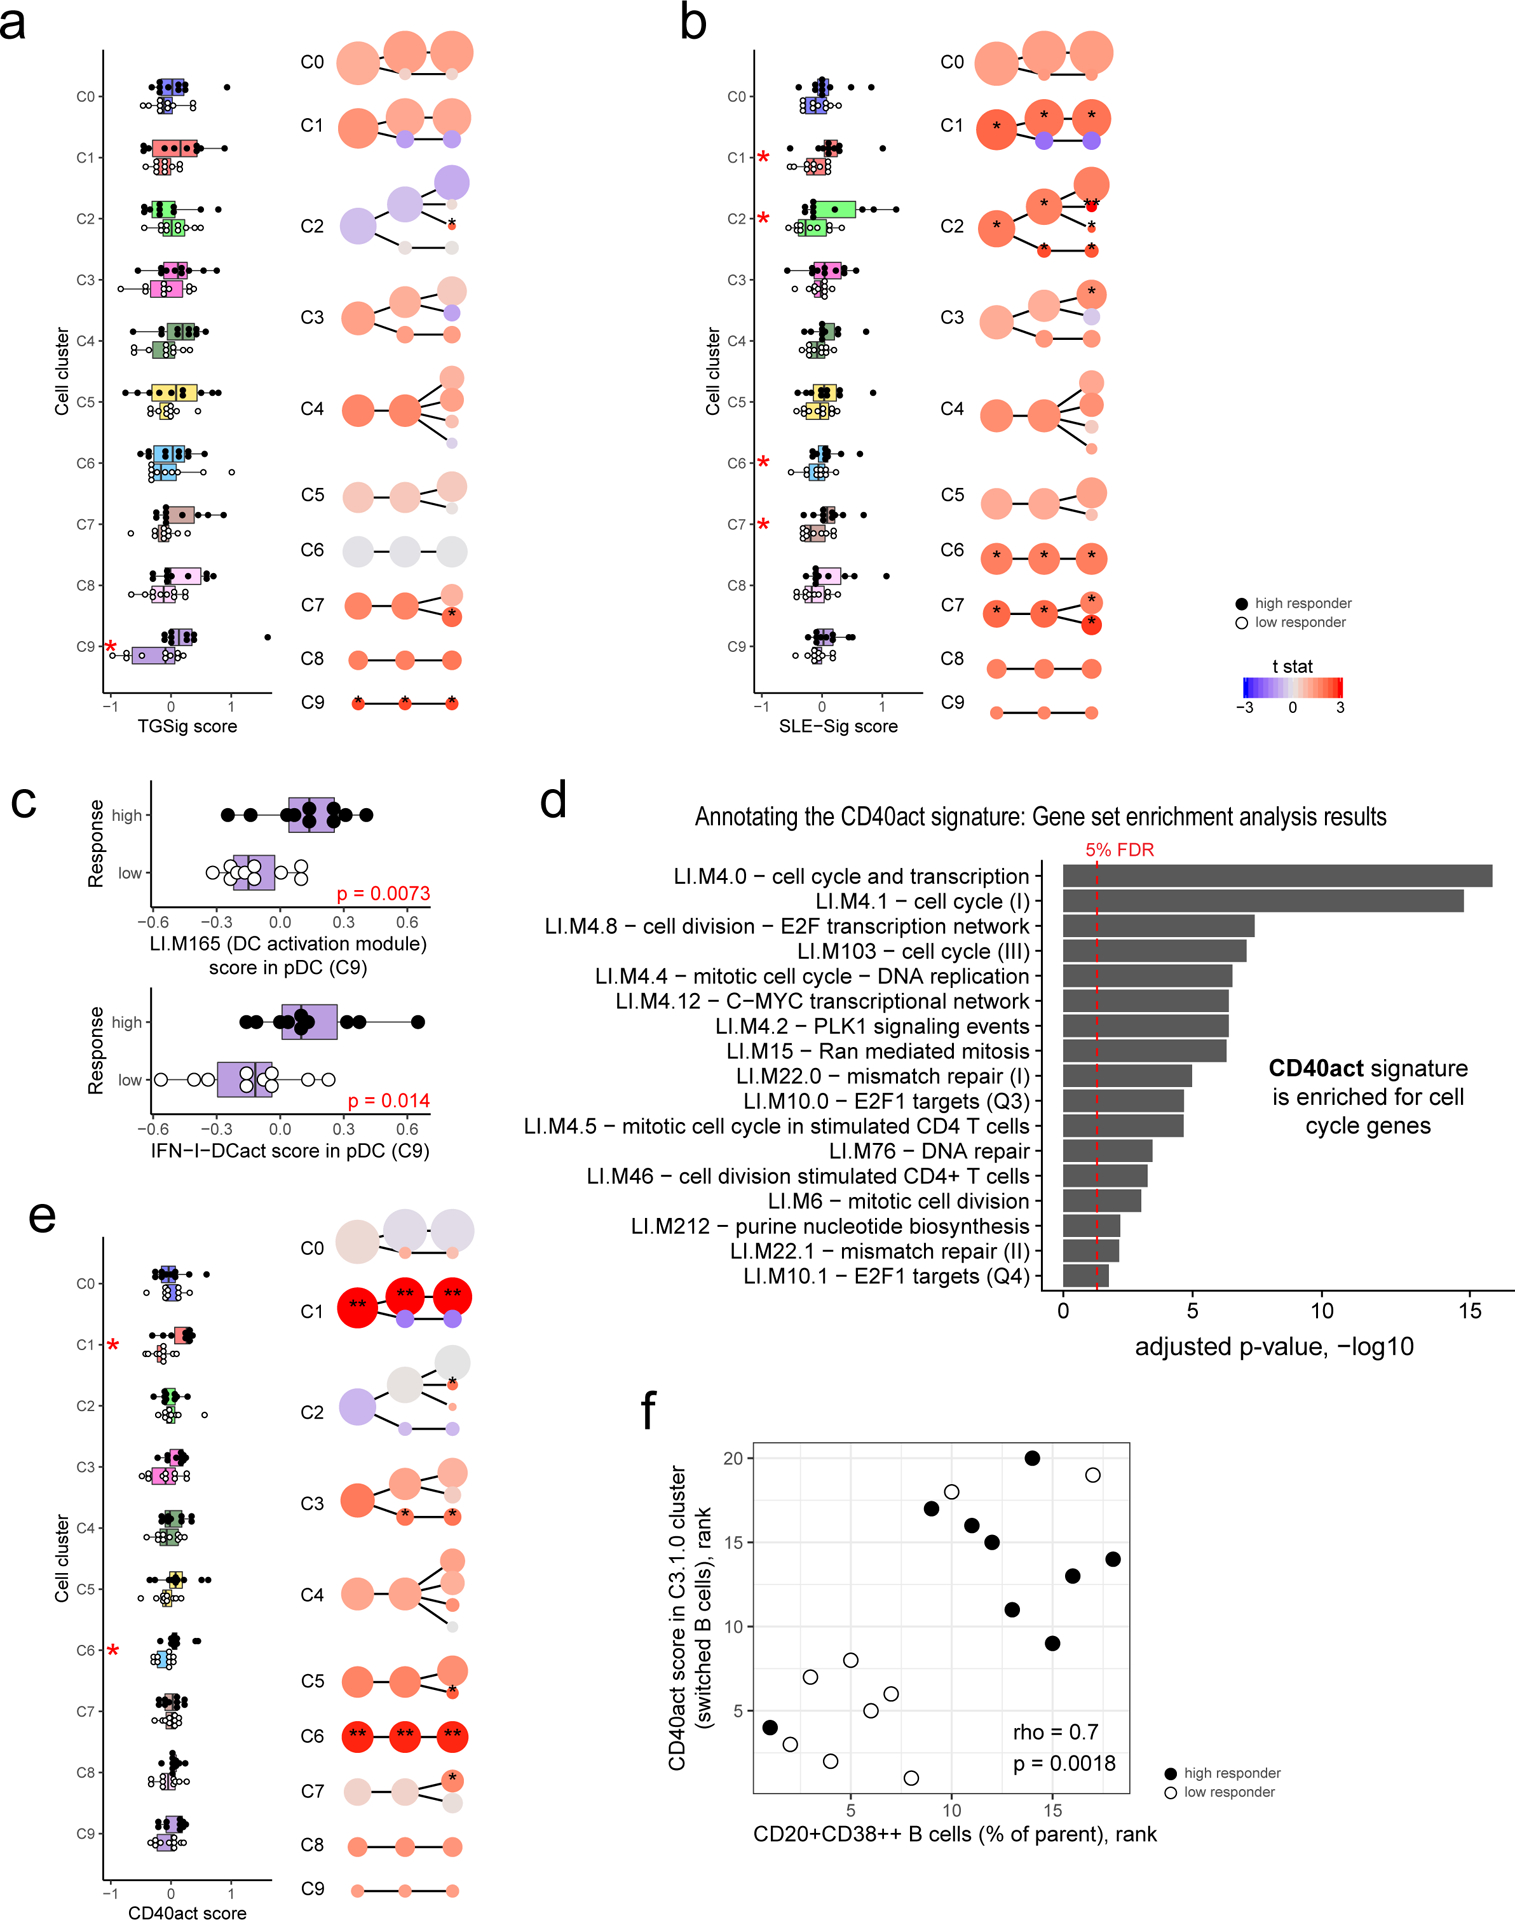
a, Evaluating the difference in TGSig score between high (n=10) and low (n=10) responders in each cell cluster from Fig. 4b (see Methods). Left panel: boxplot comparing high (solid dot) and low (empty dot) responders in each of the level 1 (1st column) clusters; each dot corresponds to the signature score of a subject. Red asterisks denote significance with p<0.05 (Wilcoxon one-tailed test; see also Supplementary Table 7). Right panel uses the same visualization as in Fig. 4b but here the color reflects the average normalized difference in TGSig signature score between the high and low responders (shown here as a t statistic). One or two asterisks denote significance with p<0.05 or p<0.01, respectively (Wilcoxon one-tailed test because we are interested in assessing whether the high responders are higher than the low responders; see also Supplementary Table 7). For all boxplots the center line corresponds to the median value, lower and upper hinges correspond to the first and third quartiles (the 25th and 75th percentiles); lower and upper whiskers extend from the box to the smallest or largest value correspondingly, but no further than 1.5x inter-quantile range. b, Same as (a) but for SLE-Sig. c, Similar to the boxplots in the left panel of (a) (10 high versus 10 low responders) but for the signature score of the LI.M165 BTM (top panel: enriched for dendritic cell activation) and the IFN-I-DCact (bottom panel; see Fig. 3f) gene sets evaluated for cells in the pDC cluster only (cluster C9). d, Enrichment analysis result of the CD40act gene set (Supplementary Table 6; 49 genes) using the hyper-geometric test against the BTMs from ref21. All 32,738 detected genes were used as a background. BTMs with an adjusted one-tailed p-value (FDR computed using the BH method) of 0.05 (red line) or lower are shown. e, Same as (a) but for CD40act. f, Scatterplot (based on ranks since Spearman correlation is being evaluated) assessing the correlation between the frequency of CD20+CD38++ B cells (see Fig. 1b) and the CD40 activation signature score in the switched B cell cluster (C3.1.0 – see Fig. 4b,c). Spearman correlation and two-tailed p value are shown (based on 9 high and 9 low responders because not all 20 subjects assessed by CITE-seq have corresponding flow cytometry data). Detailed test statistics for data shown in (a), (b), and (e) can be found in Supplementary Table 7.