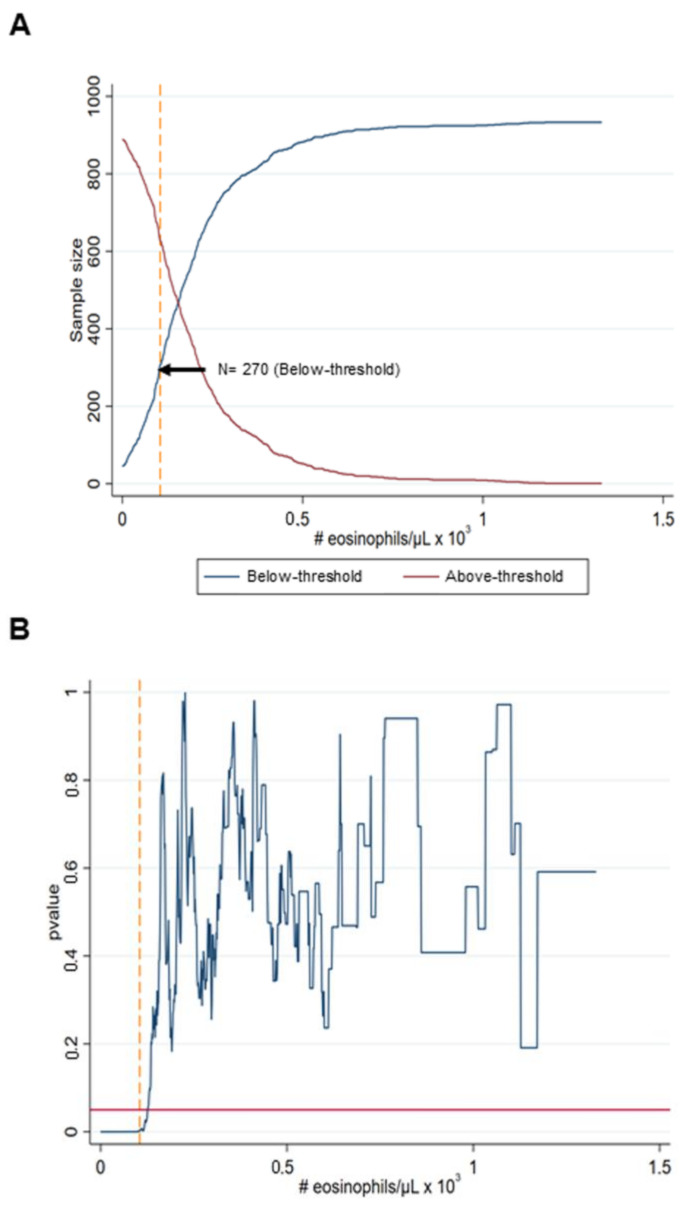
Figure 2.
Selection of the eosinophil threshold for patient clustering. (A) Number of patients in the below-threshold cluster for increasing the eosinophil thresholds. The point indicated by the black arrow corresponds to the percentage of the patients’ threshold in the below-threshold, which led to the most balanced cluster sizes. (B) Statistical significance resulting from the Mann–Whitley U test as a measure by the corresponding p-value for varying thresholds (in terms of the percentage of patients belonging to the below-threshold cluster). The horizontal solid red line shows the statistical significance threshold p = 0.05, while the vertical yellow dashed line shows the optimal threshold of the eosinophil counts corresponding to the p-value.

