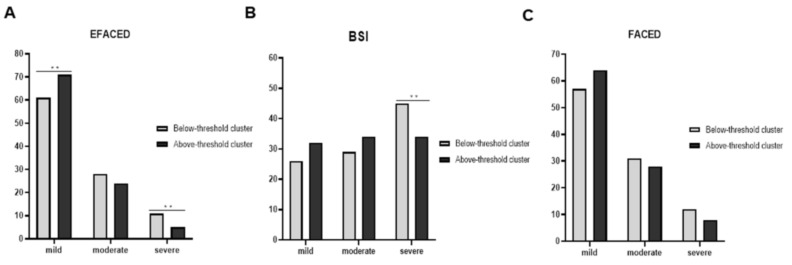
Figure 3.
Histograms of the proportions of patients who were classified as mild–moderate–severe according to EFACED (A), BSI (B), and FACED (C) between the two clusters. EFACED: mild: 0–3, moderate: 4–6, and severe: 7–9; BSI: mild: 0–4, moderate: 5–8, and severe: ≥ 9; and FACED: mild: 0–2, moderate: 3 to 4, and severe: 5–7. Statistical significance: **, p < 0.01 between the patient groups.

