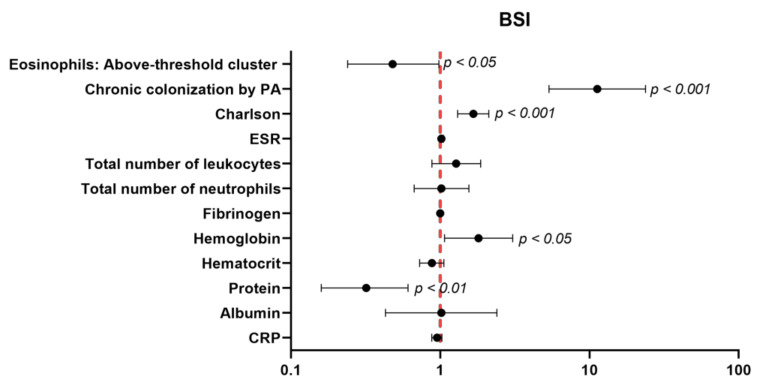
Figure 5.
The independent association of dichotomized eosinophils with severe BSI. A multivariate regression analysis was used to perform the analysis. The confidence intervals and statistical significance are represented in the figure panel. The odds ratio is represented as black dots. The model was adjusted by chronic colonization by the PA, Charlson Index, ESR, total number of leukocytes, total number of neutrophils, fibrinogen, hemoglobin levels, hematocrit levels, protein, albumin, and CRP levels.

