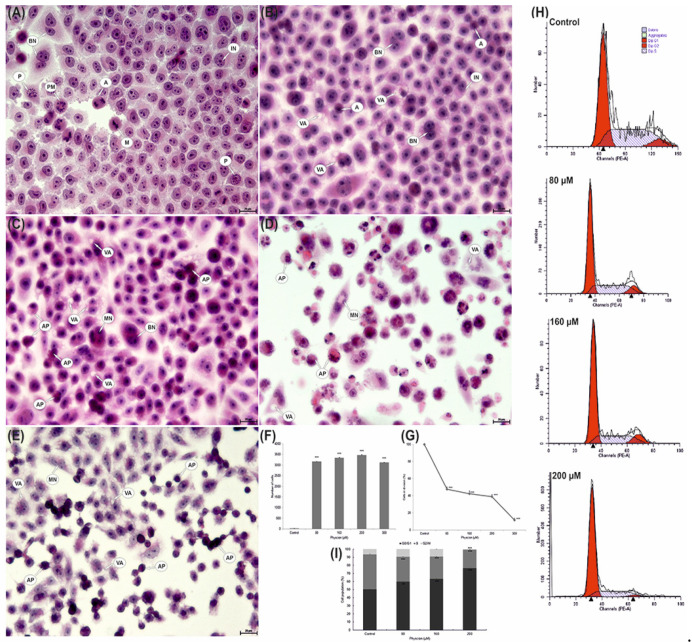
Figure 6.
Morphological changes in HeLa cells after 48 h of exposure to physcion. (A) Control cells with normal morphology and numerous cells in division. (B) Cells with vacuoles present in the cytoplasm (80 µM). Numerous cells with strong cytoplasmic vacuolization covering the entire cell area and numerous apoptotic cells (C—160 µM, D—200 µM and E—300 µM). IN—interphase, P—prophase, PM—prometaphase, M—metaphase, A—anaphase, AP—apoptotic cells, VA—cells with cytoplasmic vacuolization, BN—binuclear cells, MN—multinucleated cells. Hematoxylin and eosin staining. Magnification, ×4000. (F) Number of cells with cytoplasm vacuolization. (G) Mitotic index of HeLa cells. Data correspond to mean values ± S.E. from three different experiments. The differences were confirmed statistically at: *** p < 0.001. (H) Effect of physcion at concentrations (80 µM, 160 µM and 200 µM) on cell cycle progression in HeLa cell lines. (I) Percentage of cells in different phases of the cell cycle. Cell cycle distribution was analyzed by flow cytometry. Data correspond to mean values ± S.E. from three different experiments. The differences were confirmed statistically at: *** p < 0.001.

