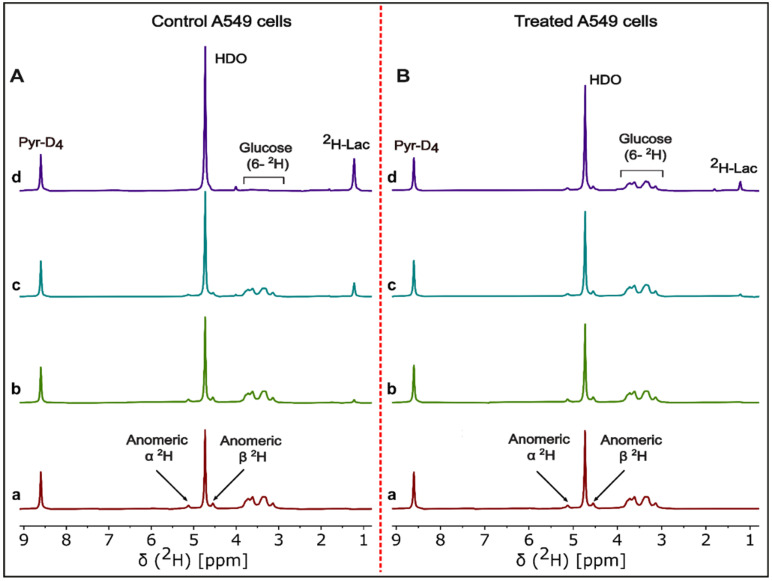
Figure 1.
Representative 2H-NMR spectra of cell media time course analysis. Stacked plot of 2H-NMR spectra of DMSO control (left, panel A) and β-lapachone treated (right, panel B) of the A549 cell line incubated with 5.5 mM [2H7]glucose. Cell media samples were withdrawn at (a) 0 min, (b) 30 min, (c) 2 h, and (d) 6 h incubation time points of the β-lapachone post-treatment cultures of A549 cancer cells. Labeling in the (a and d) spectra of panel A,B shows the signals for pyrazine-D4, HDO, residual [2H7]glucose, and 2H-lactate.

