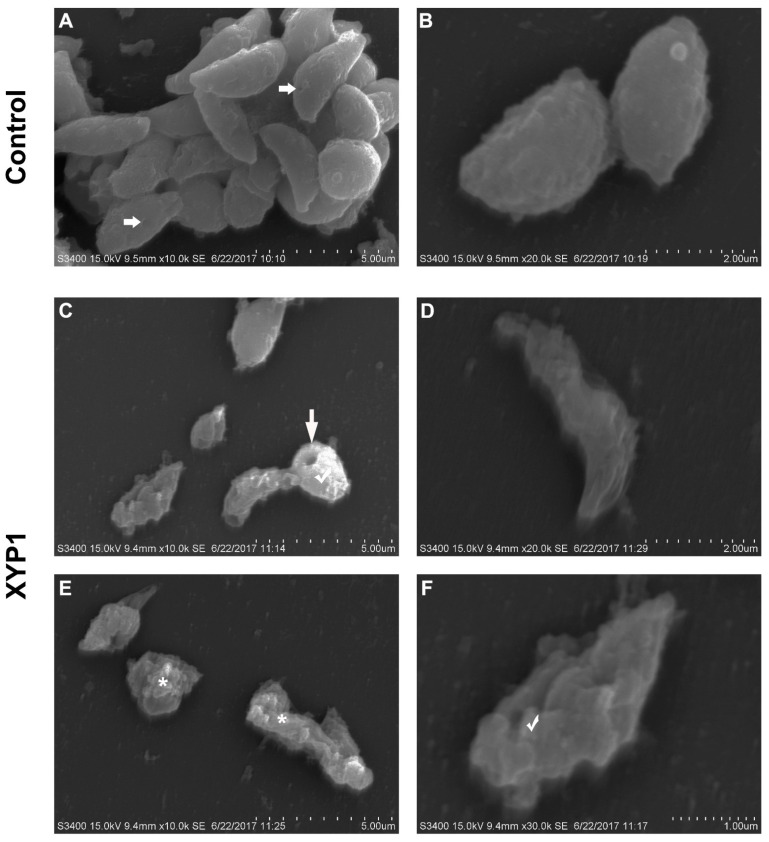
Figure 5.
Morphological changes of T. gondii tachyzoites treated with XYP1 as visualized by SEM. Parasites treated with DMEM were defined as the negative control (A,B). Parasites were exposed to 10 μM XYP1 for 2 h (C–F). Markers: horizontal arrows (→) in A: primary portal of tachyzoites; vertical arrow (↓) in C: hole of tachyzoites; asterisk (*) in E: disintegrated tachyzoites; hooks (√) in c and F: swelled tachyzoites. Scale bars = 5 μm (A,C,E); 2 μm (B,D); 1 μm (F).

