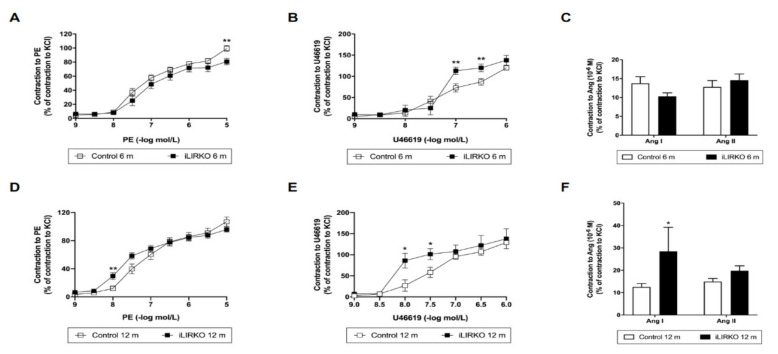
Figure 3.
Vascular contraction analysis in control and iLIRKO mice: contractile responses to PE (A,D), U46619 (B,E) and Ang I/II (C,D). (A) Control (n = 21) and iLIRKO (n = 12) mice. (B) Control (n = 11) and iLIRKO (n = 5) mice. (C) Control (n = 14–16) and iLIRKO (n = 5) mice. (D) Control (n = 14) and iLIRKO (n = 11) mice. (E) Control (n = 4–6) and iLIRKO (n = 4) mice. (F) Control (n = 9–10) and iLIRKO (n = 3) mice. Results are expressed as mean ± SEM. The statistical significance was represented as * (p < 0.05) and ** (p < 0.01) vs. control mice.

