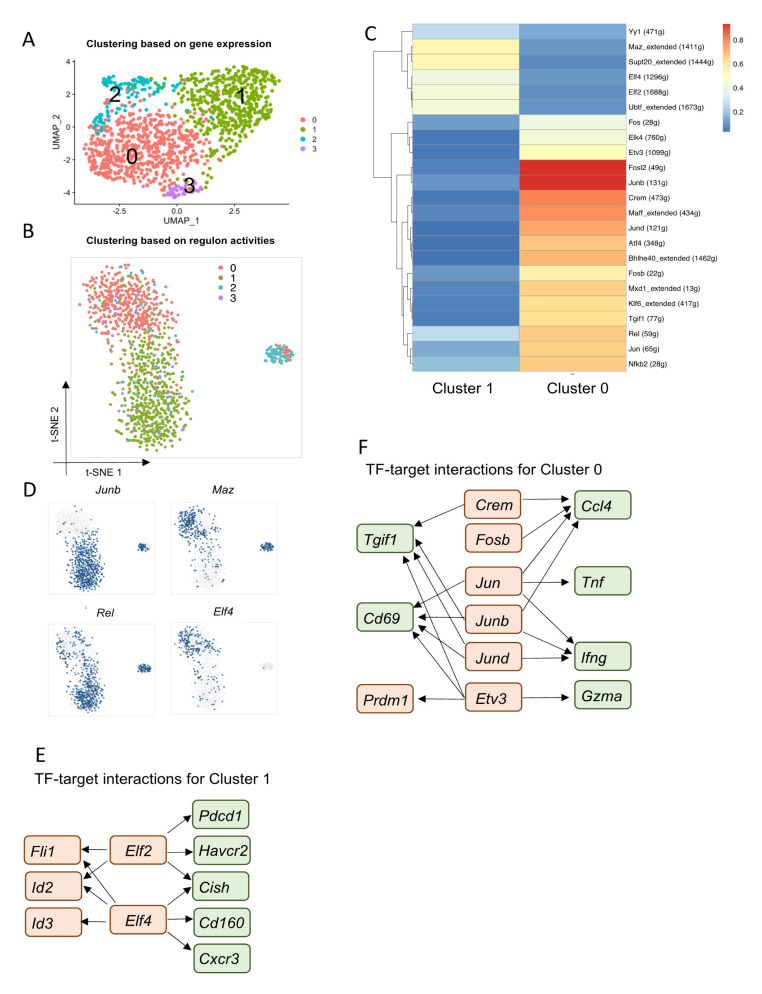
Figure 4.
Core regulatory programs that determine heterogeneous TRM populations in siIELs: (A) Unsupervised clustering of TRM cells based on gene expression identified four major populations when visualized by UMAP. scRNA-seq data were generated from siIEL GP33+ CD44+ CD8+ cells, 30 days post-LCMV Armstrong infection. (B) Unsupervised clustering based on regulon activity separated cells into three major populations when visualized by tSNE. Colors denote the CD8+ T-cell subsets identified by gene expression profiles. (C) Heatmap showing the average regulon activity in Clusters 0 and 1. Scale bar denotes SCENIC AUC score. Numbers in parentheses denote the number of co-expressed and direct target genes of each transcription factor. (D) t-SNE projections showing binary regulon activity of example regulons for TRM subsets. (E,F) Gene regulatory networks showing TF-target interactions for Cluster 1 and Cluster 0. Key TFs are highlighted in red, putative regulated genes are highlighted in green.

