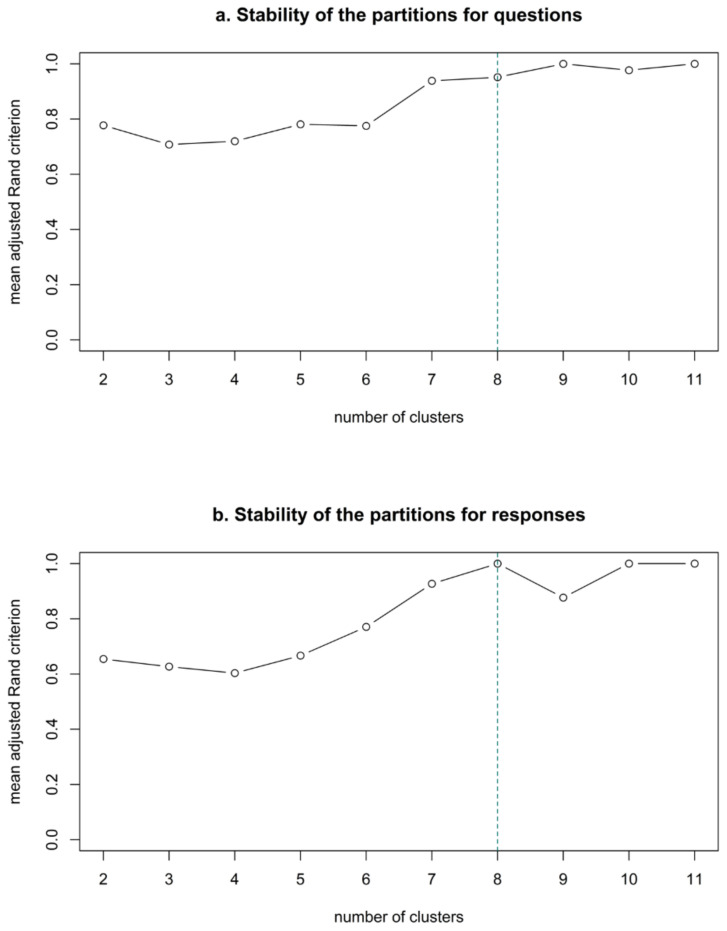
Figure 7.
Stability plot for questions (a) and responses (b). This plot evaluates the stability of partitions from a hierarchy of variables, using bootstrap samples (n = 22) of the question and response trees. The mean of the corrected Rand indices measures the similarity between clusterings based on co-occurrences [101], and is plotted according to the number of clusters. The partitions are interpreted as stable when the curve stops increasing.

